

 After uploading data to BloodHound, use the Explore page to search for objects and visualize their relationships. The graph displays and , helping you understand your environment and identify potential attack paths.
If your account uses Environment Targeted Access Control (ETAC), search results and graph data are limited to the environments you can access.
BloodHound supports all search methods for structured graphs. If you’re exploring generic graphs, you can use the Search and Cypher methods only.
Search
Find specific objects by name or node type
Pathfinding
Discover relationships between objects
Cypher
Perform complex search with Cypher queries
Search
The Search tab allows you to quickly find specific nodes in the graph by name or object ID. As you type in the search text box, BloodHound automatically suggests nodes that match your search query. You can click on any of the suggestions to select and display that node in the graph. Use cases for the search method include:- Object discovery: Quickly locate a known object by name or type to inspect its properties
- Investigation prep: Find starting points for deeper exploration using Pathfinding or Cypher queries
- Data validation: Verify specific objects are present in your environment after data ingestion
Search by name or object ID
For example, if you want to find a user named “bob”, type “bob” in the search box and click the appropriate node from the suggestions.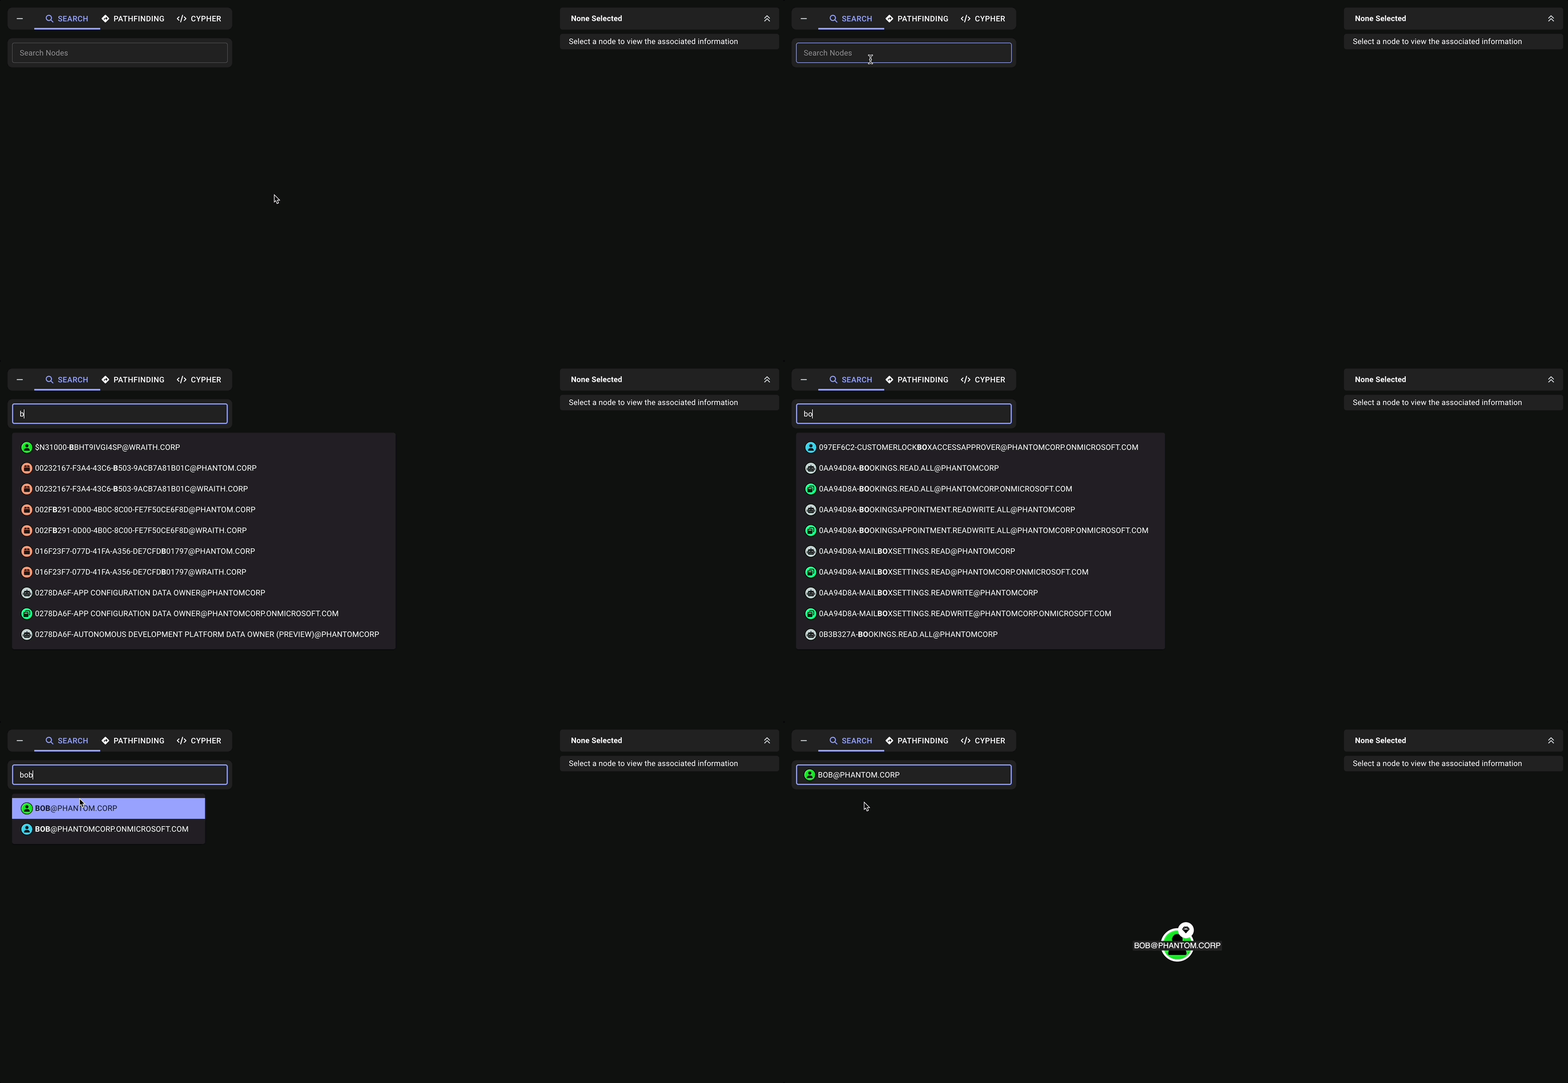
Filter by node type
You can also constrain your search to particular node types by prepending your search with the appropriate node label. For example, use the following search query to find group nodes that contain the word “admin”:Note that all suggestions for the 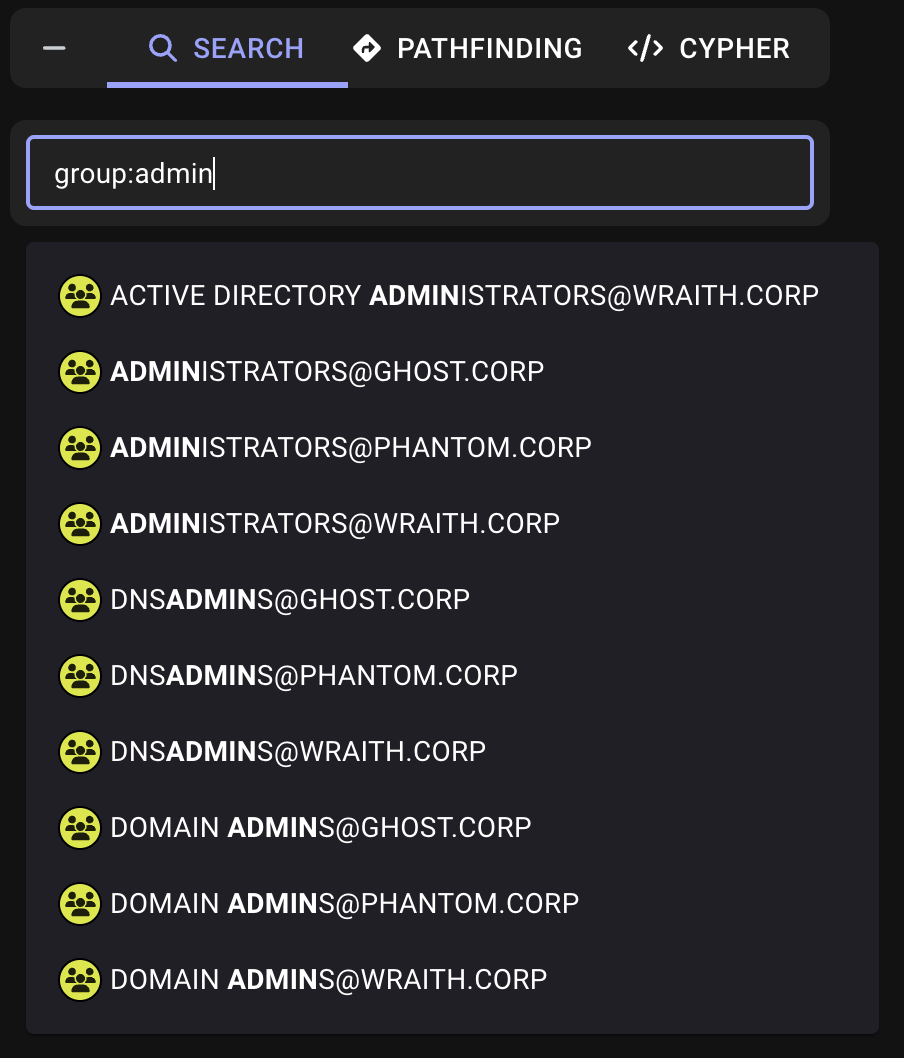
group:admin search query include the group node type icon:Pathfinding
The Pathfinding tab allows you to discover relationships between two nodes. You can add up to two additional destination nodes to narrow the results, which helps you focus on a particular part of the graph.When ETAC applies to your user account, pathfinding returns data from the environments you can access only.
- Attack path analysis: Identify potential compromise chains through two nodes
- Focused path analysis: Require paths to include one or two additional destination nodes to focus on a specific part of the graph
- Relationship mapping: Understand how objects are connected within your environment
- Filtered exploration: Focus on relevant relationships by excluding edge types or reversing path direction
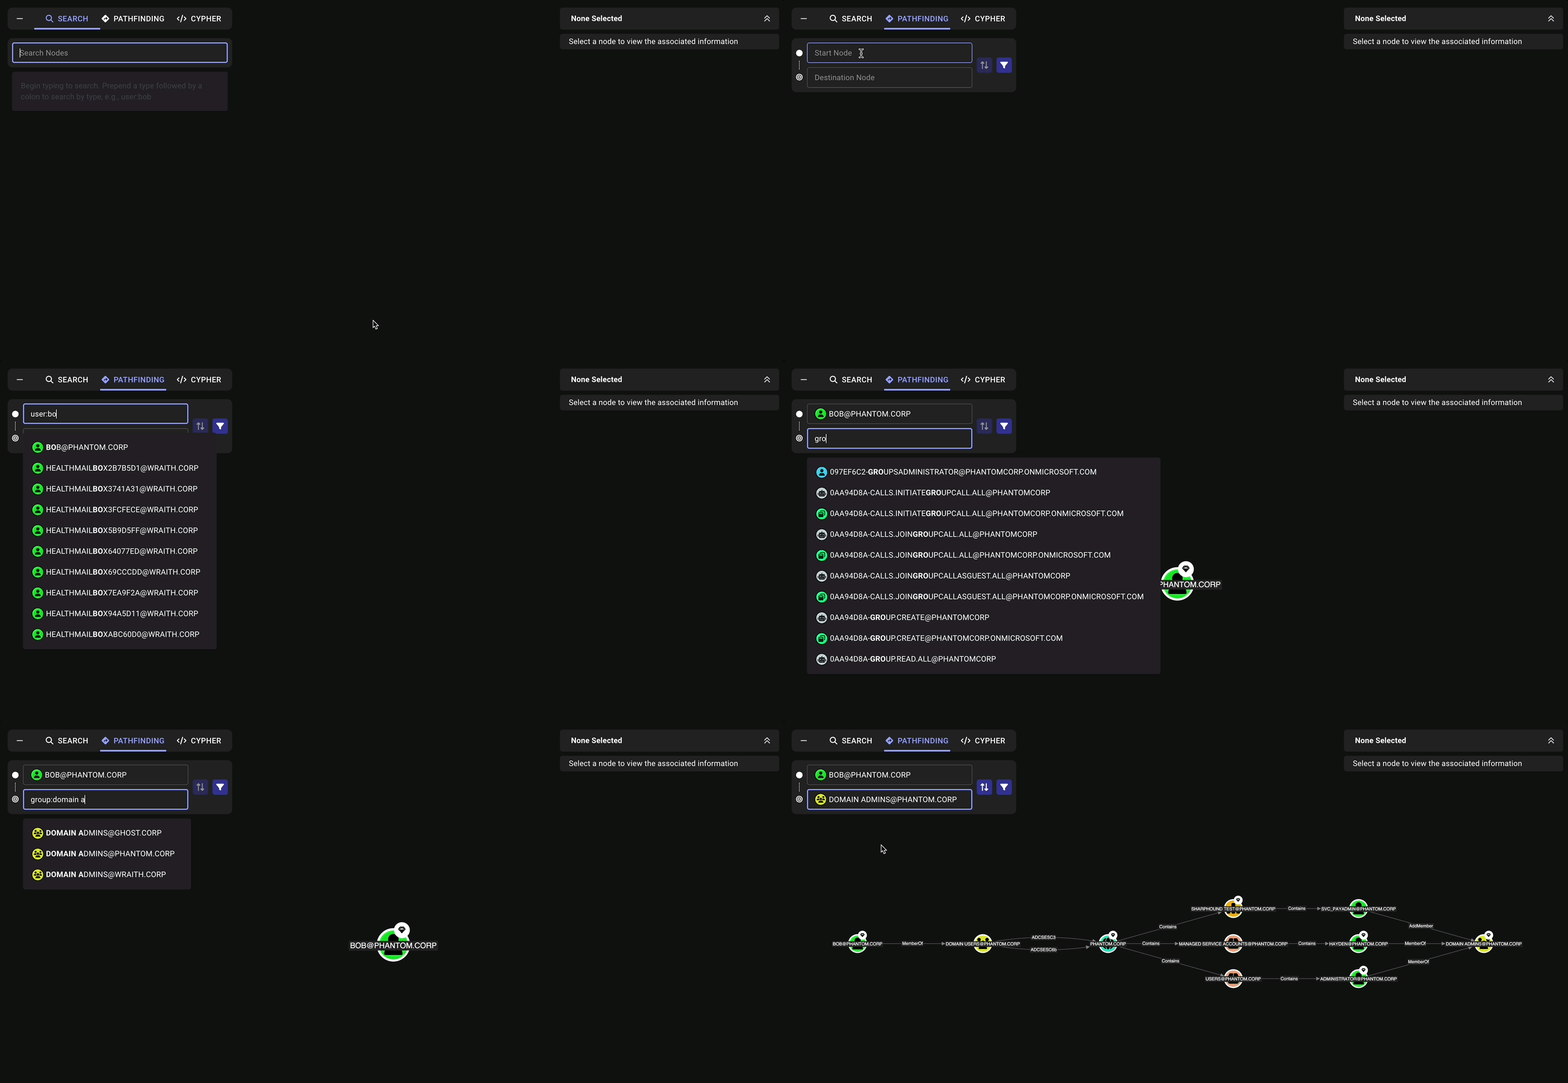
- Add destination—Add up to three destination nodes to the search. BloodHound adds each destination to the end of the route.
- Reorder nodes—Drag a node row to change its position in the route. You can also focus the reorder handle and use the arrow keys. The first node is the start node, and the remaining nodes are destinations. BloodHound reruns the pathfinding search after you reorder the nodes.
- Remove destination—Remove a destination node from a multi-destination search.
- Reverse path—Swap your start and destination nodes in a two-node search to explore paths in the opposite direction without re-entering your search queries. This is useful for finding how high-value targets connect back to entry points.
- Filter edges—Select which edge types to include in each path. By default, all edge types are selected; deselect any you don’t want included in the results to focus on relevant relationships.
Cypher
The Cypher tab allows you to perform complex searches using queries. Cypher is a powerful query language for graph databases. It enables you to manipulate and examine BloodHound data in custom ways to help you further understand your network or identify interesting relationships.See Search with Cypher for more information.
Graph view
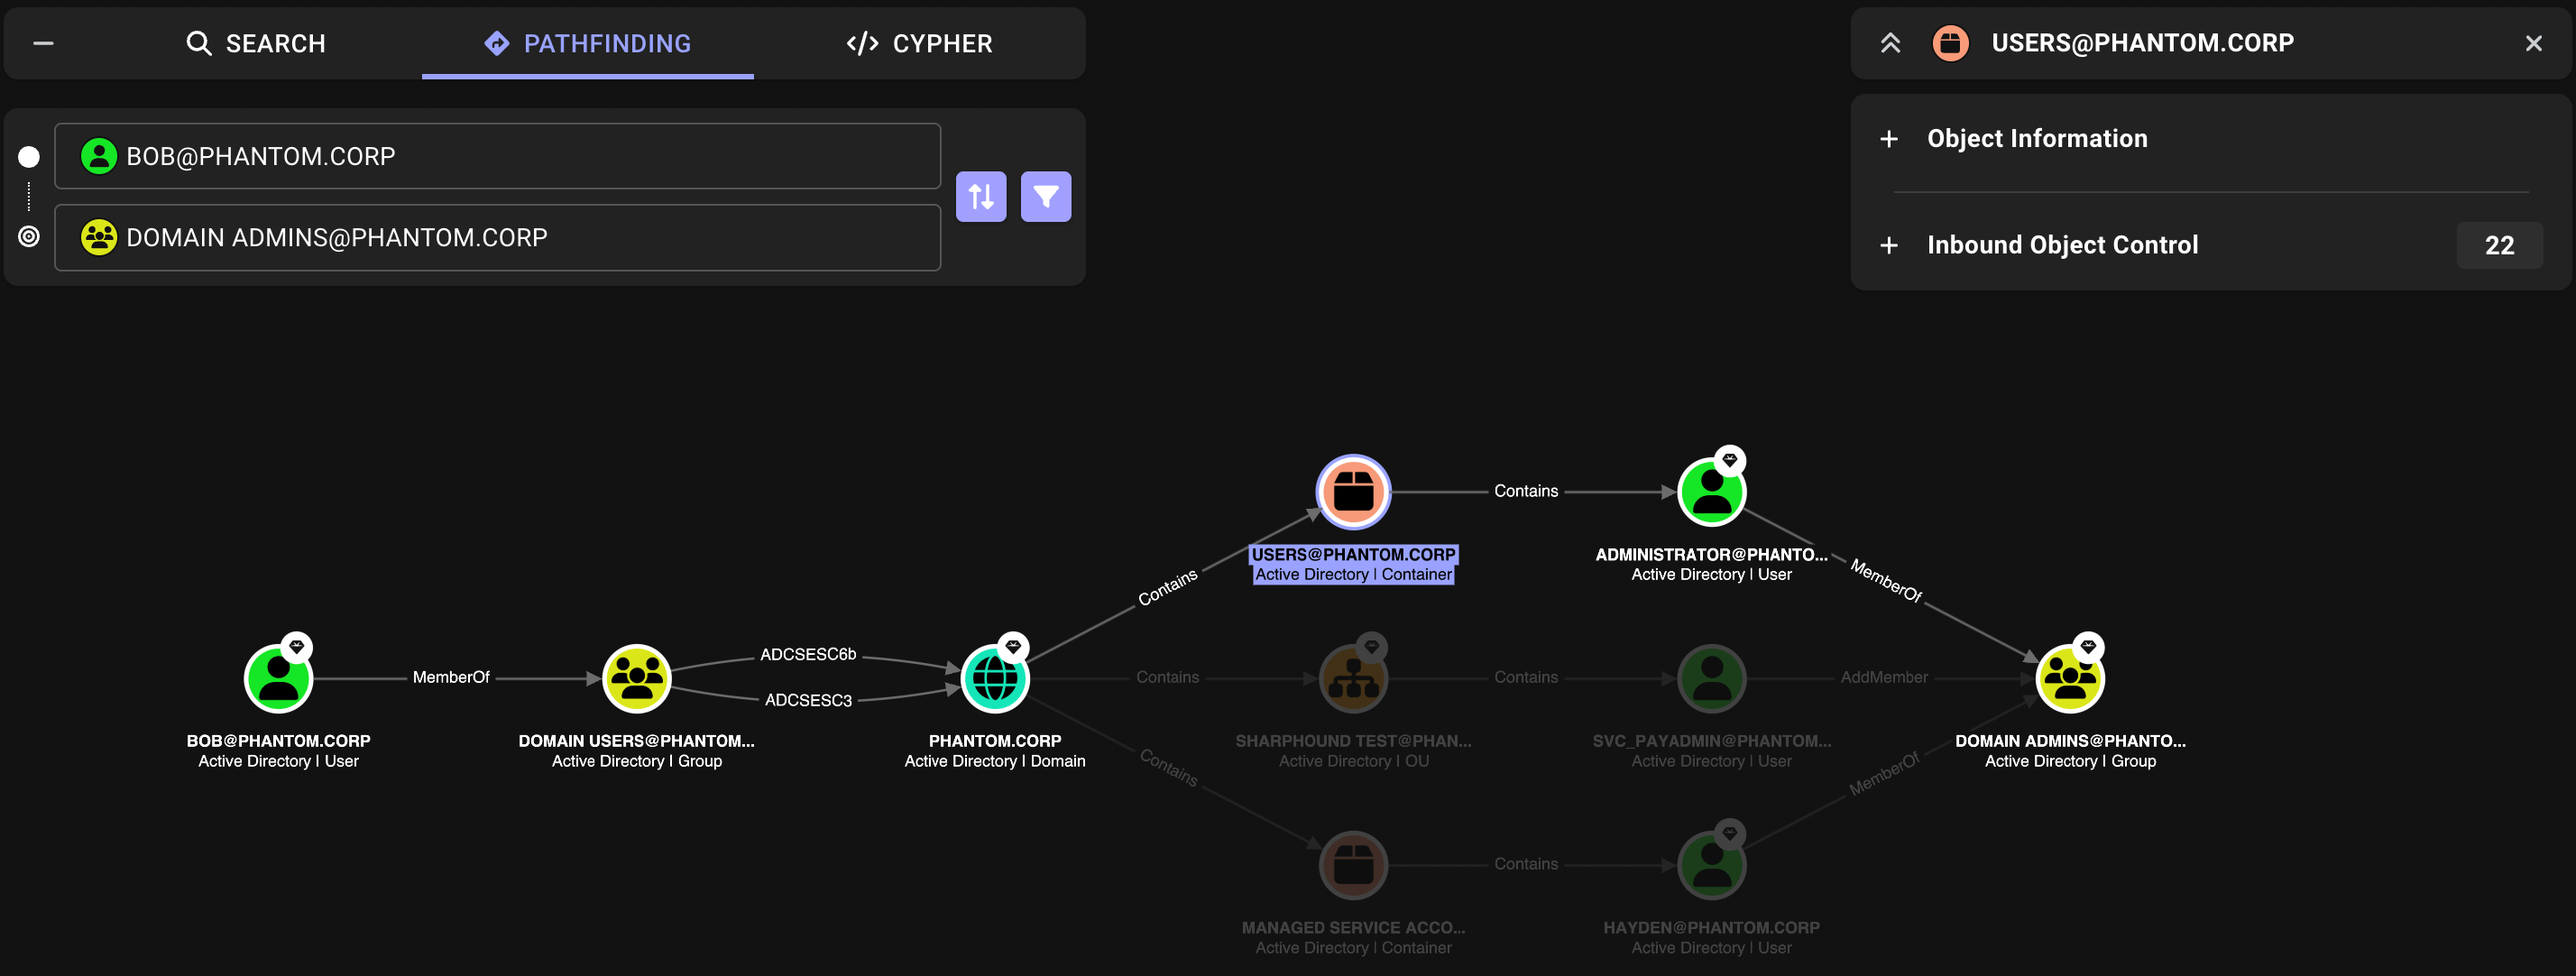
The graph on the Explore page provides a visual representation of the objects in your data based on your search criteria. You can interact with the graph by clicking on nodes and edges to view detailed information about them in the Entity panel, and by using various visualization options to customize the graph view. The following example shows a graph based on the example in the Pathfinding section above, which finds paths from a user named “bob” to a group named “domain admins”.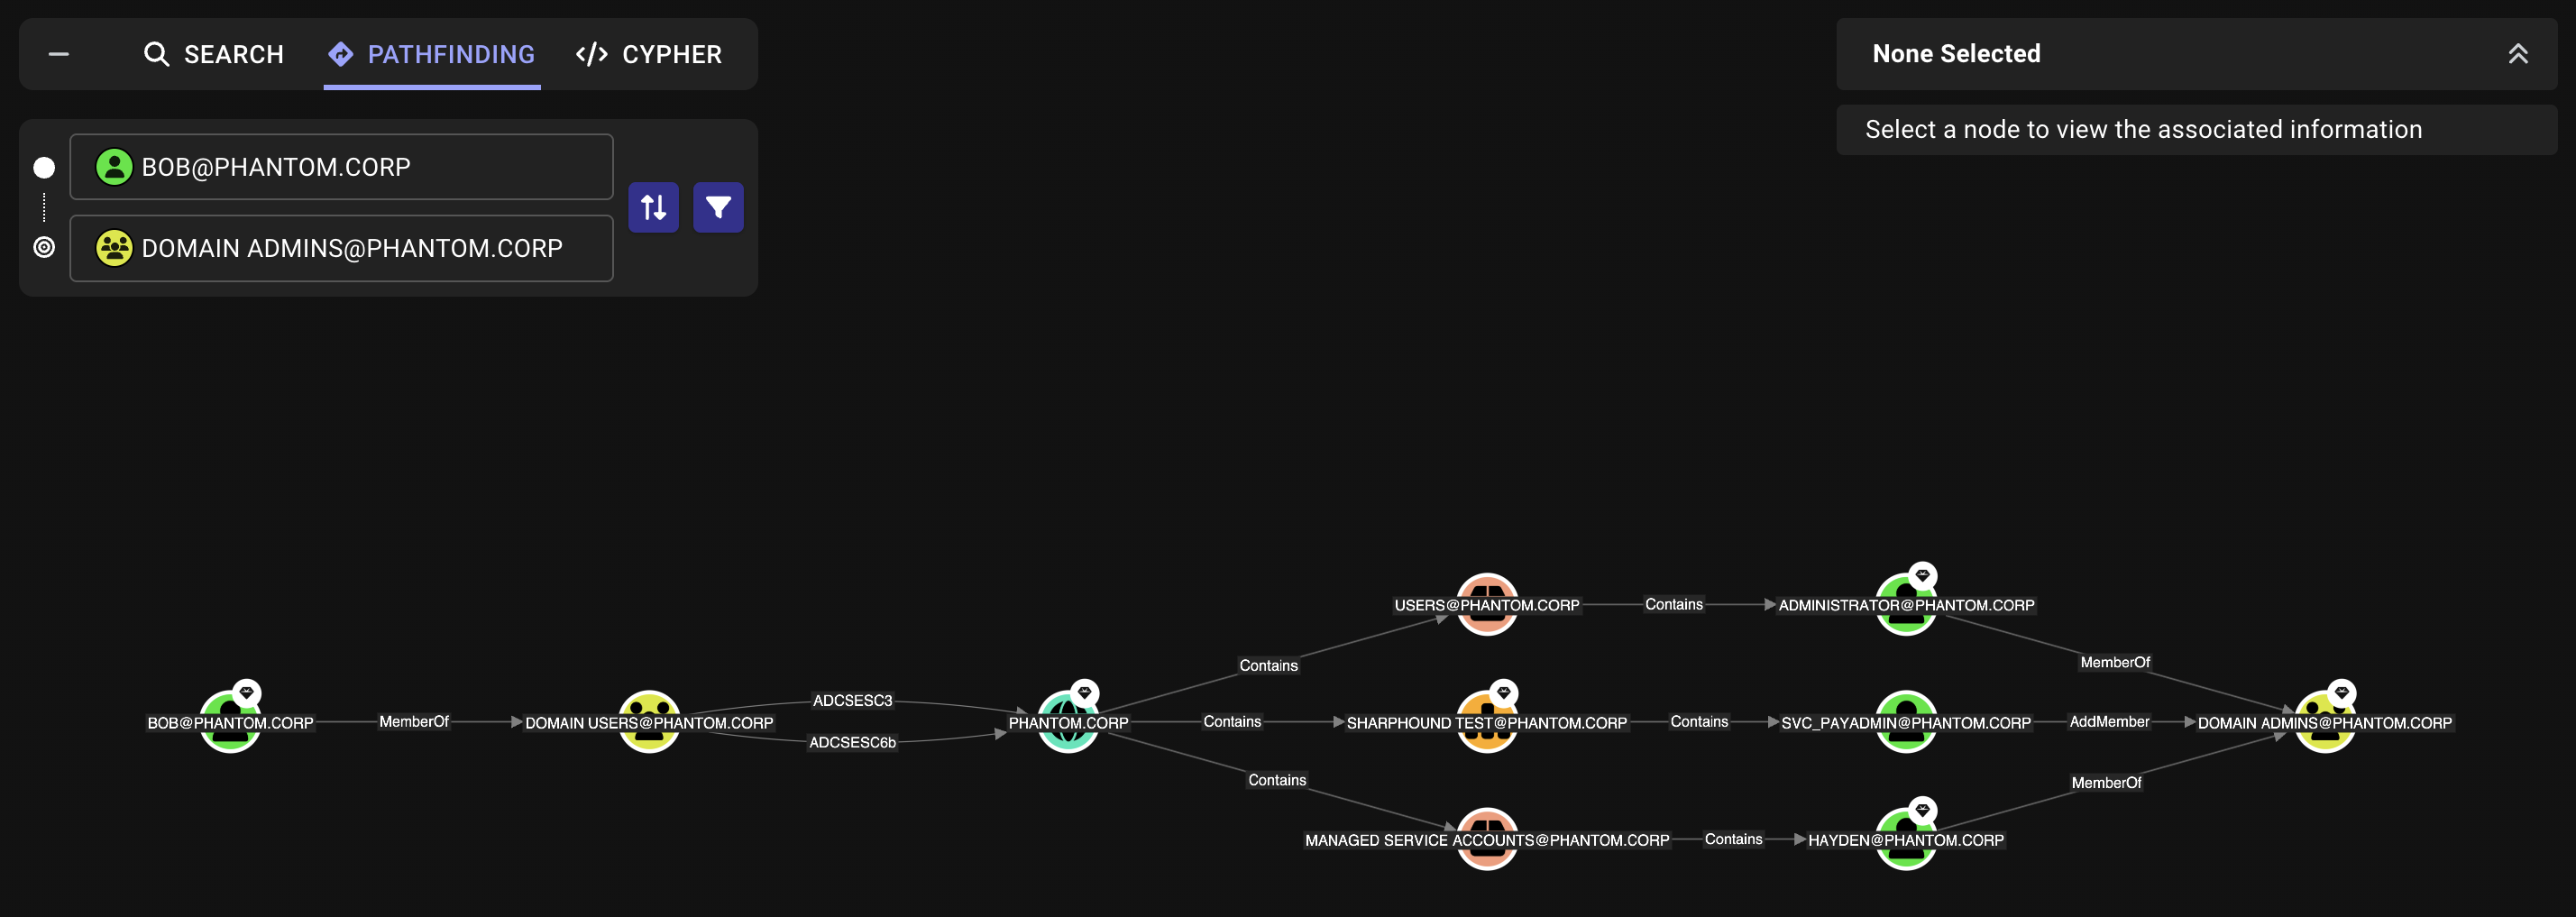
BOB@PHANTOM.CORP to group DOMAIN ADMINS@PHANTOM.CORP, allowing you to visually explore the relationships between objects.
Object interaction
You can interact with nodes and edges in the graph to view detailed information about them in the Entity panel. For nodes, you can right-click to perform more actions using the context menu. To keep dense graphs readable, BloodHound clips long node labels by default. Click a node to view its full label. When you click a node, BloodHound dims unrelated nodes and edges and highlights every path that traverses the selected node. This includes inbound and outbound object control paths, making it easier to isolate how the selected node participates in the current graph. For example, clickingUSERS@PHANTOM.CORP in the previous graph highlights the path through that node to DOMAIN ADMINS@PHANTOM.CORP and dims the other paths that do not traverse it.
Context menu
Right-click on any node in the graph to access the context menu. Options in the context menu include:-
Set as starting node—Set the node as the starting point in the Pathfinding tab.
- If a pathfinding search is already in progress, BloodHound redraws the graph using the current destination nodes.
- Otherwise, BloodHound displays only the selected node so you can continue building the pathfinding search.
-
Set as ending node—Set the node as the destination in the Pathfinding tab.
- If a pathfinding search is already in progress, BloodHound redraws the graph from the current starting node through the selected destination and any remaining destination nodes.
- Otherwise, BloodHound displays only the selected node so you can continue building the pathfinding search.
- Add to/Remove from Tier Zero—Mark or unmark the node as a member of the Tier Zero privilege zone. Adding automatically triggers analysis to tag the object; removing requires manually editing the zone rule to remove the object.
- Add to/Remove from Owned—Mark or unmark the node as compromised in the Privilege Zones page. Adding automatically triggers analysis to tag the object; removing requires manually editing the label rule to remove the object.
- Copy—Copy the node’s name, object ID, or a Cypher query to your clipboard for use in other searches or documentation.
Entity panel
The Entity panel on the Explore page displays detailed object properties and relationships. The information is displayed in an accordion format based on the selected node or edge, which can vary depending on your data source.For built-in node and edge types (AD/AZ), BloodHound displays structured data organized into the accordions described below. For OpenGraph data, BloodHound displays all values from the
properties object as a flat list, without the structured accordions.
BloodHound displays the following information in the Entity panel when you click on an edge (if the information is available in your data):
Visualization options
Use the graph visualization options at the bottom of the Explore page to customize how the graph is displayed based on your preferences. This can be useful for large, complex graphs with many nodes and edges. Layout behavior depends on whether you explicitly choose a layout:
- Reset graph view—Restore the graph view to its default layout and zoom level
- Hide Labels—Toggle the visibility of labels on nodes and edges to reduce clutter and focus on the structure of the graph (also useful for obfuscating sensitive information before sharing graph images)
-
Layout—Choose from the following layout options to organize the graph visually:
- Organic
- Stacked
- Sequential
- Standard
- Table
 Uses a force-directed layout algorithm to position objects based on their relationships, creating a natural and intuitive view of the graph.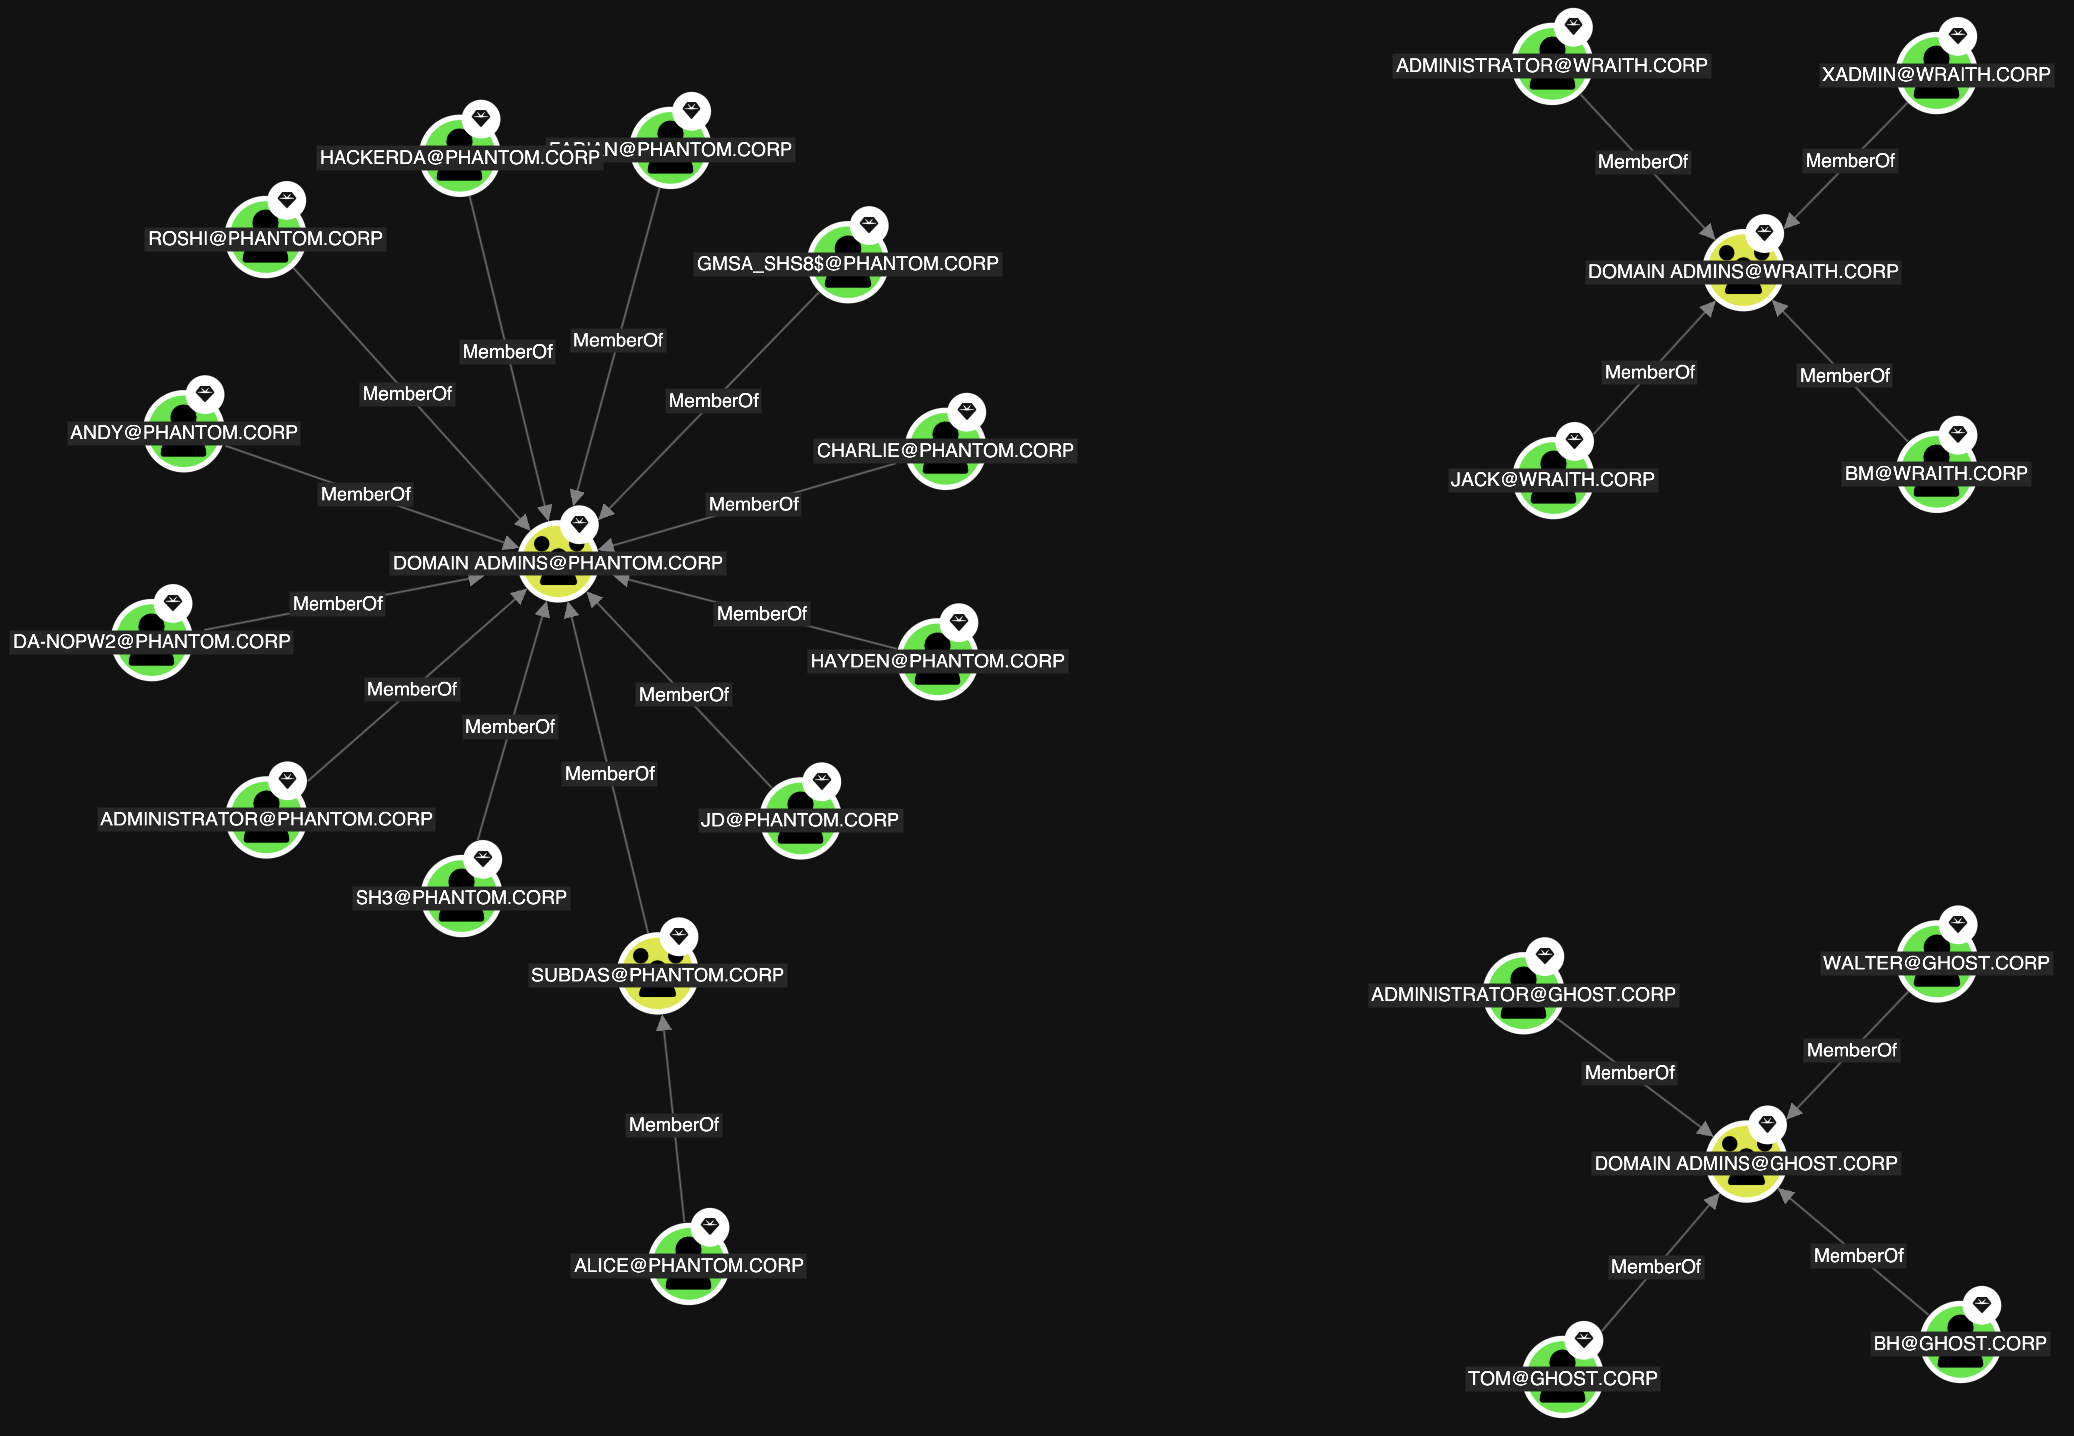
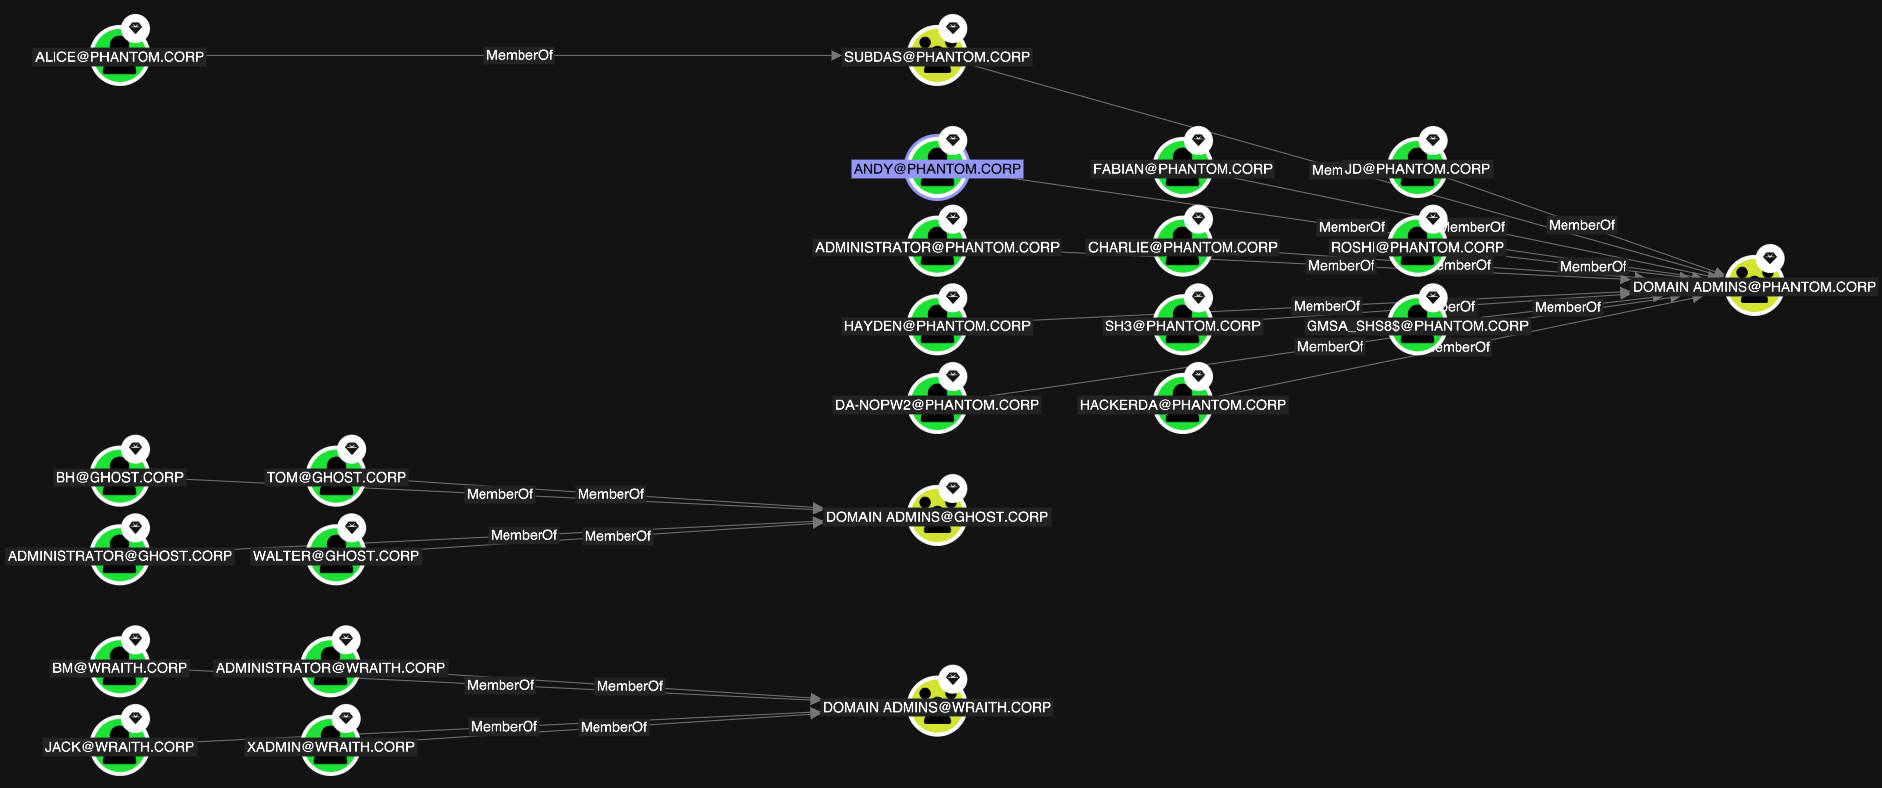
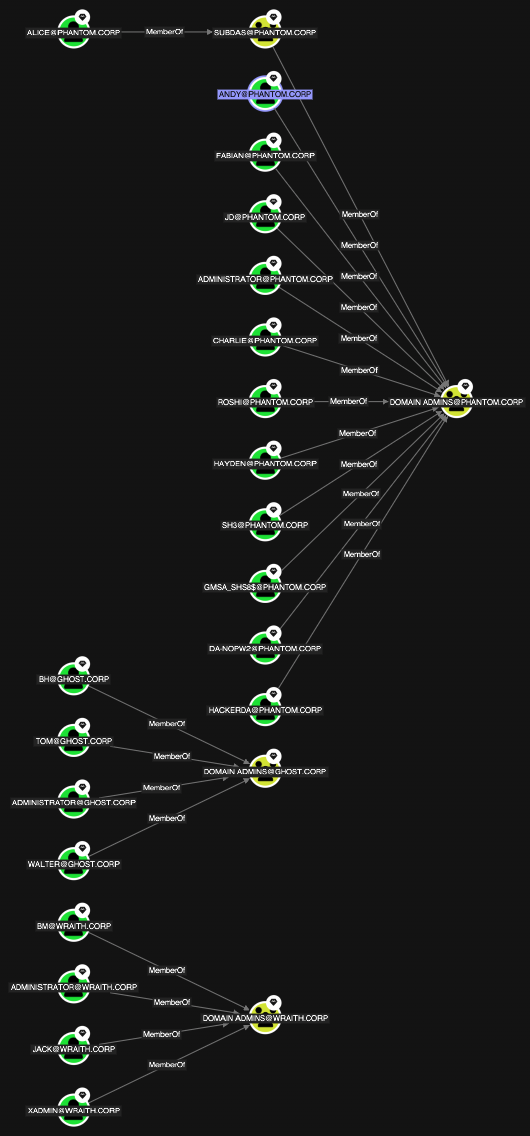
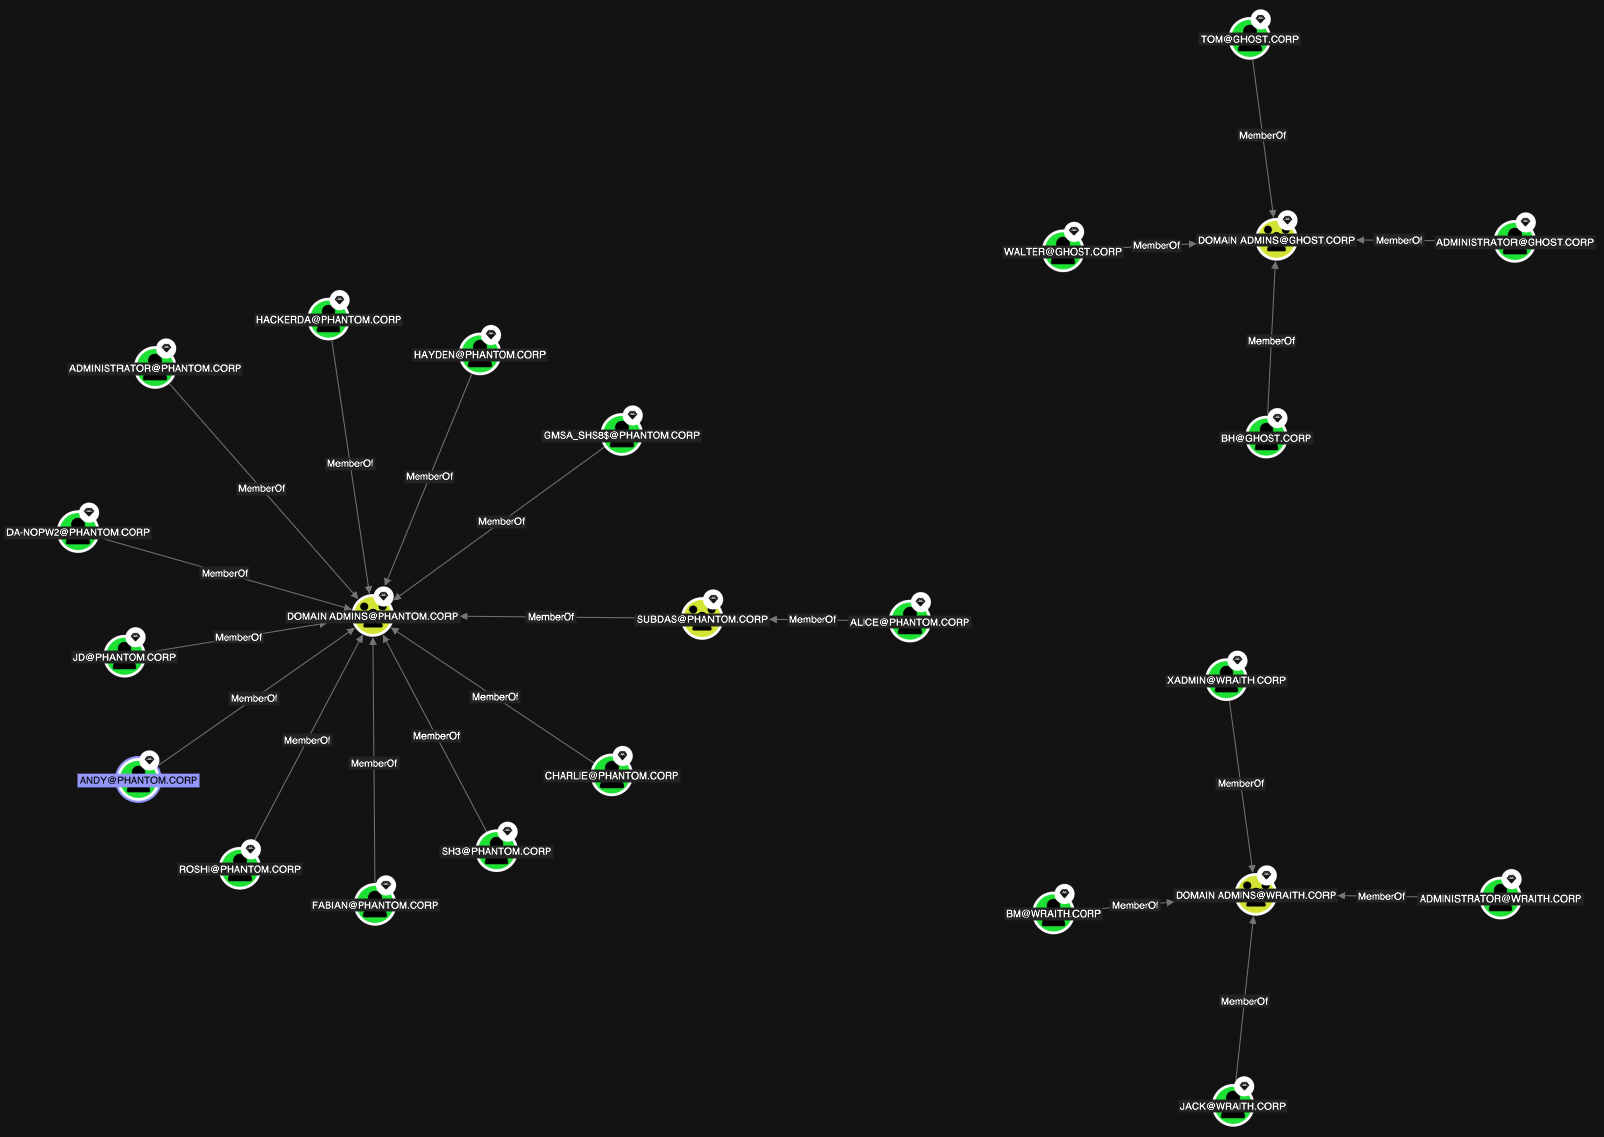
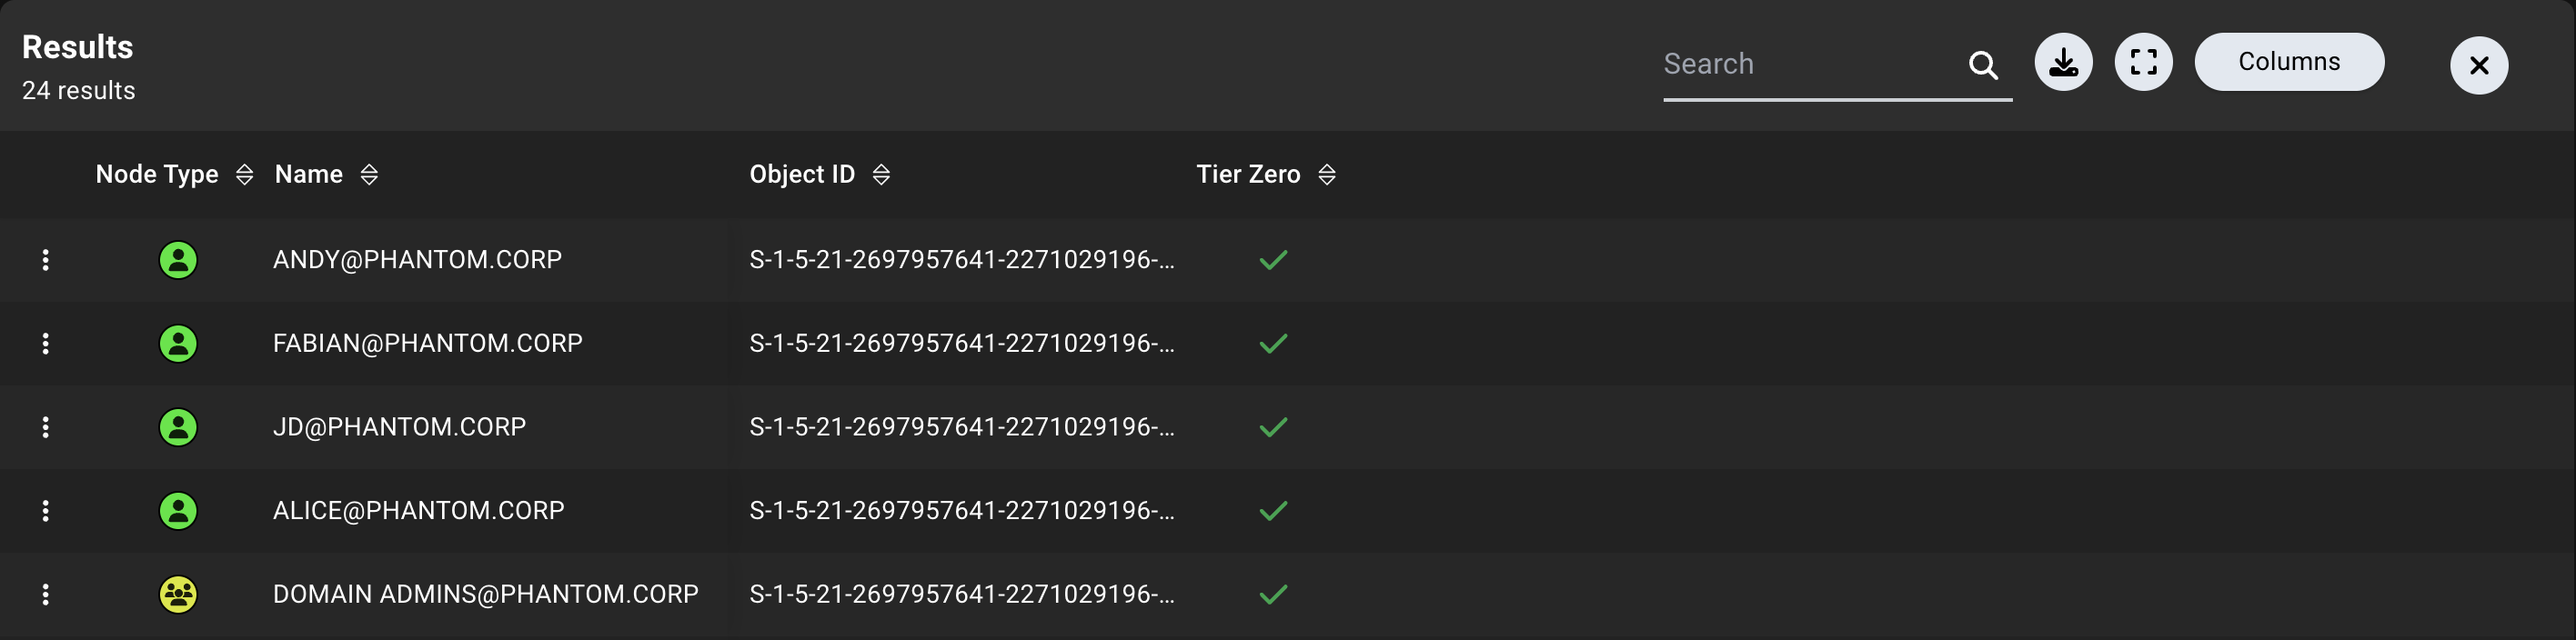
Graph visualization options are available across all search methods. The Table layout is available for Cypher searches only.