Introduction
For several years, one of the biggest pain-points with contributing to BloodHound has been in getting nodes and edges ingested and correctly displayed in the GUI. BloodHound OpenGraph changes that. Now it is easy for anyone to add nodes and edges into BloodHound through the easy-to-use/file-upload/ endpoint.
However, while the process of adding nodes and edges to the product is greatly simplified, the product will not function as expected without a well-designed attack graph model. This document seeks to educate users on attack graph model design theory, best-practices, and requirements.
An attack graph is a tool - a powerful force multiplier when wielded correctly, a frustrating and confusing hazard when not. This document aims to equip you with the knowledge and skills necessary to effectively wield this tool.
At this time, OpenGraph nodes and edges are not supported in the Search or Pathfinding tab, so the Cypher tab must be used to query the data manually.
Basic Attack Graph Vocabulary and Design Theory
Graphs are well-understood, well-studied mathematical constructs. You can find thousands of guides, tools, and academic papers that make use of graphs. This document will not replace a proper education or time spent working with graphs. But in this section we will touch on the most fundamental aspects of a graph you must understand in order to effectively get BloodHound to work with your nodes and edges. Every graph is constructed from two fundamental components: vertices (nodes) and edges (relationships):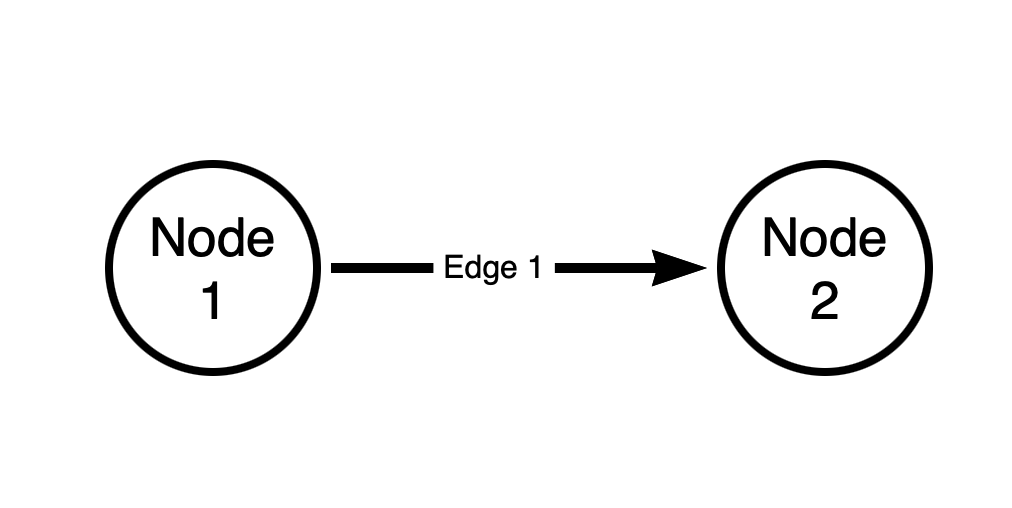 The above graph has two nodes and one edge. The edge is directed. The source node of the edge is “Node 1”. The destination node of the edge is “Node 2”.
Every edge in a BloodHound attack graph is directed, and is one-way. There are no bi-directional (“two-way”) edges in a BloodHound graph.
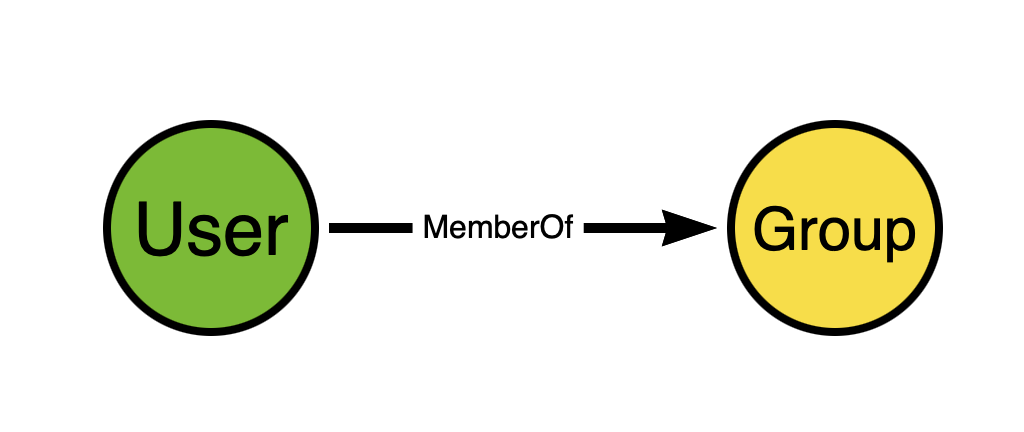
In a BloodHound attack graph, the direction of the edge must match the direction of access or attack. Let’s look at an example with Active Directory group memberships.
In the BloodHound attack graph, we model Active Directory security group memberships like this:
The above graph has two nodes and one edge. The edge is directed. The source node of the edge is “Node 1”. The destination node of the edge is “Node 2”.
Every edge in a BloodHound attack graph is directed, and is one-way. There are no bi-directional (“two-way”) edges in a BloodHound graph.
In a BloodHound attack graph, the direction of the edge must match the direction of access or attack. Let’s look at an example with Active Directory group memberships.
In the BloodHound attack graph, we model Active Directory security group memberships like this:
 Think about the direction of the edge. Now think for a moment and try to figure out why we don’t model AD security group memberships like this instead:
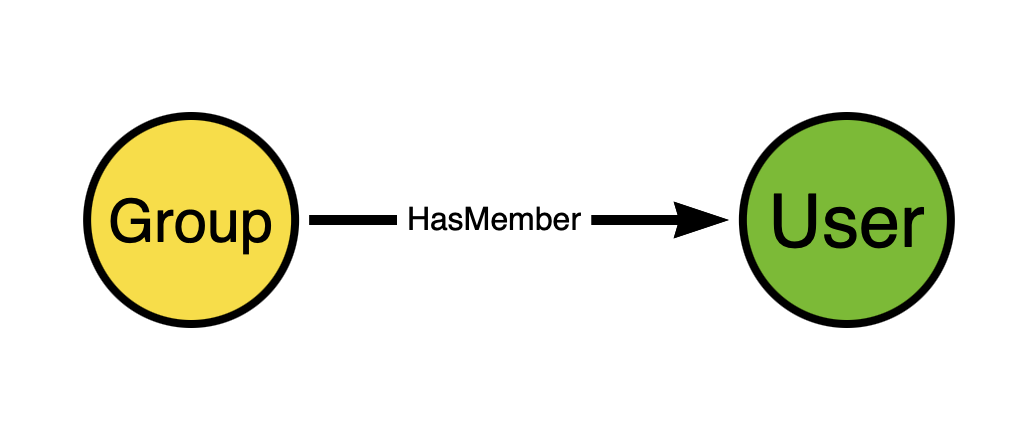 This seems perfectly reasonable at first glance, does it not? But remember that we are constructing an attack graph in order to discover attack paths. Edge directionality must serve attack path discovery.
The direction of the edge going from the group to the user does not expose any attack path. Just because a user is a member of a group does not mean the group has any “control” of the user. But when the direction of the edge is from the user to the group, that DOES serve attack path discovery.
Why? Because in Windows and Active Directory, members of security groups gain the privileges held by those groups. Let’s extend the model a bit to make this easier to see:
This seems perfectly reasonable at first glance, does it not? But remember that we are constructing an attack graph in order to discover attack paths. Edge directionality must serve attack path discovery.
The direction of the edge going from the group to the user does not expose any attack path. Just because a user is a member of a group does not mean the group has any “control” of the user. But when the direction of the edge is from the user to the group, that DOES serve attack path discovery.
Why? Because in Windows and Active Directory, members of security groups gain the privileges held by those groups. Let’s extend the model a bit to make this easier to see:
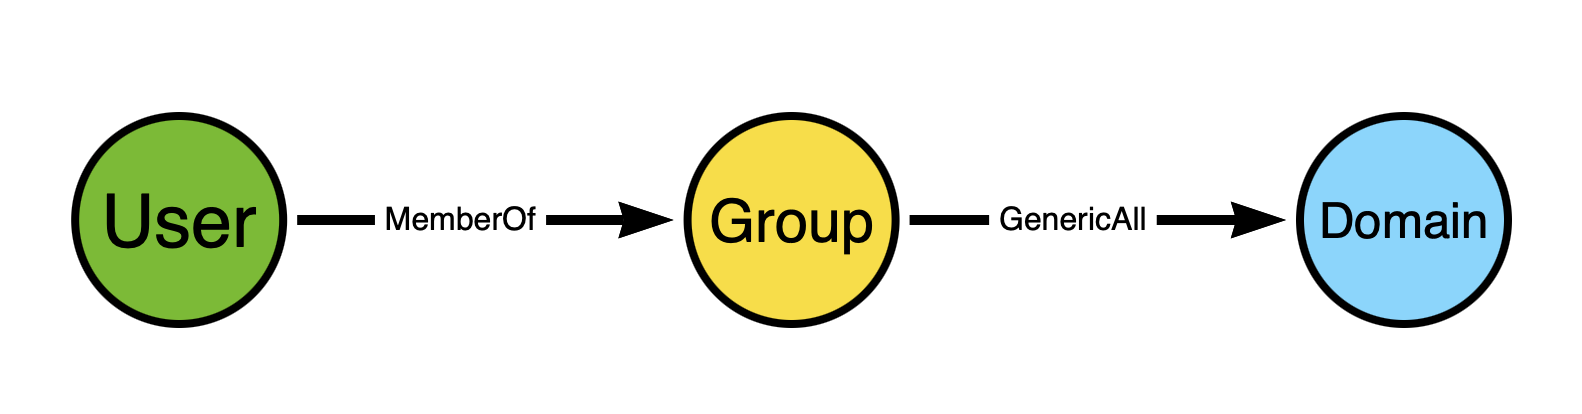 The user is a member of a group, and the group has full control of the domain. When the user authenticates to Active Directory, their Kerberos ticket will include the SID of the group. When the user uses that ticket to perform some action against the domain object, the security reference monitor will inspect the ticket, see the group SID, and grant the user all the permissions against the domain that the group has.
In reality the process is much more involved than this, but work with me here, people.
The above diagram shows a path connecting two non-adjacent nodes. Adjacent nodes are those that are connected together by an edge. In the above diagram, the adjacent nodes are:
The user is a member of a group, and the group has full control of the domain. When the user authenticates to Active Directory, their Kerberos ticket will include the SID of the group. When the user uses that ticket to perform some action against the domain object, the security reference monitor will inspect the ticket, see the group SID, and grant the user all the permissions against the domain that the group has.
In reality the process is much more involved than this, but work with me here, people.
The above diagram shows a path connecting two non-adjacent nodes. Adjacent nodes are those that are connected together by an edge. In the above diagram, the adjacent nodes are:
- “User” and “Group” via the “MemberOf” edge
- “Group” and “Domain” via the “GenericAll” edge
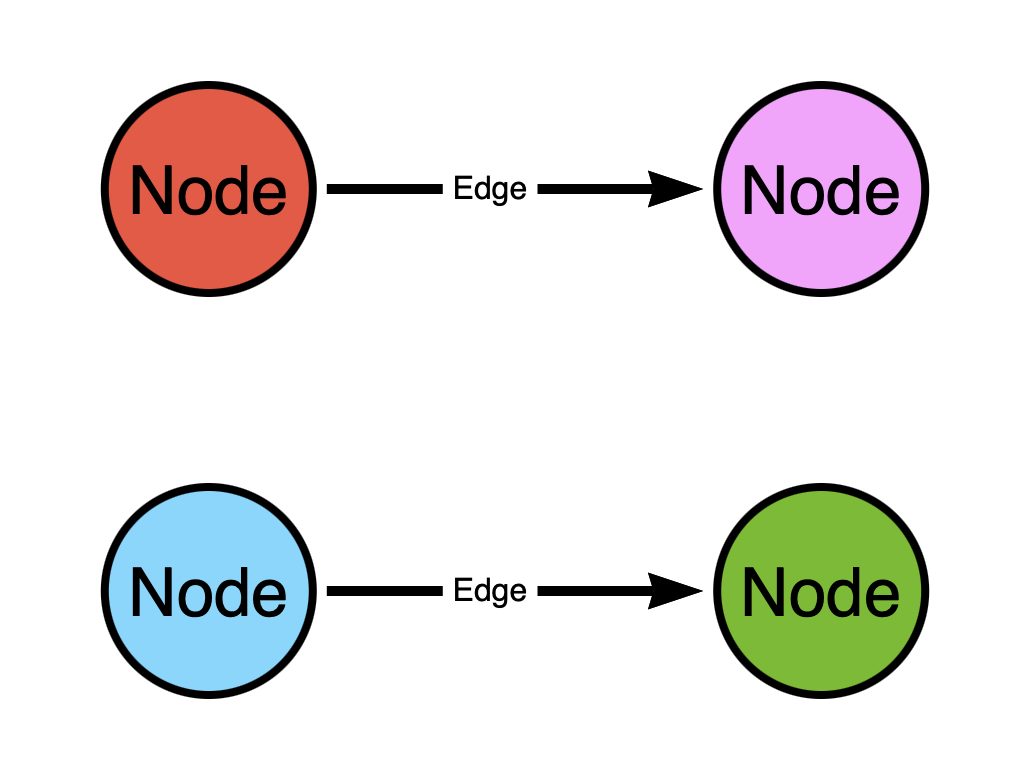 In the above graph there are two patterns:
- From the red (top left) to the pink (top right) node
- From the blue (bottom left) to the green (bottom right) node
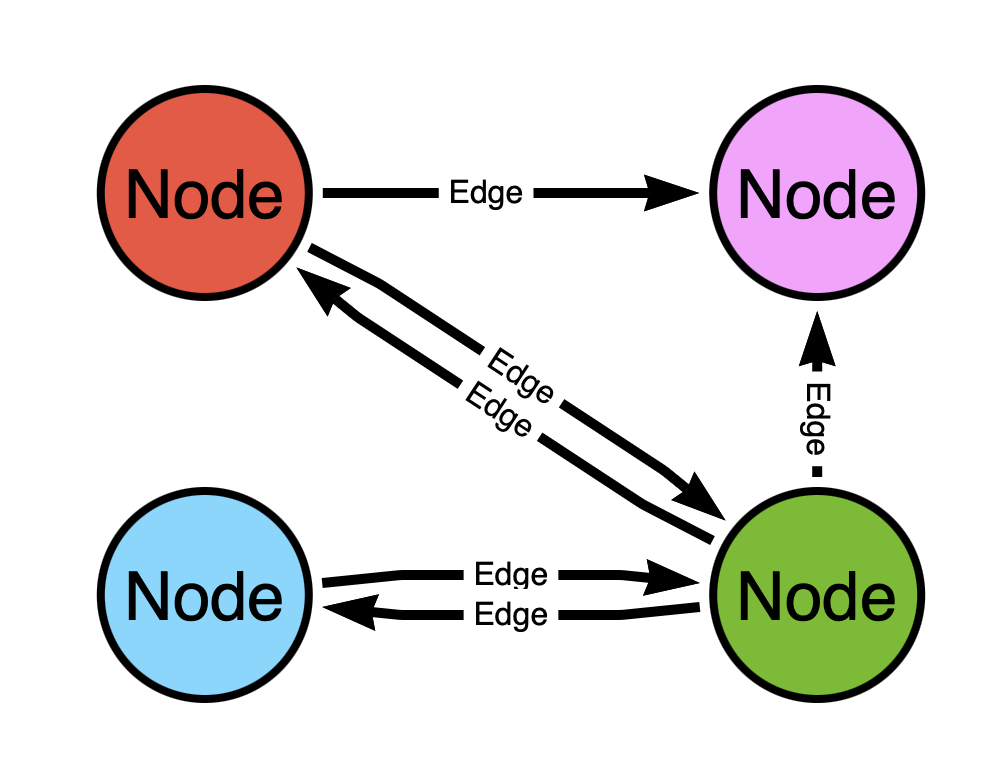 Now is there a path from the red (top left) node to the blue (bottom left) node? Yes! It goes through the green (bottom right) node!
The difference in the two graphs is the level of connectedness, or how well-linked the nodes are to one another.
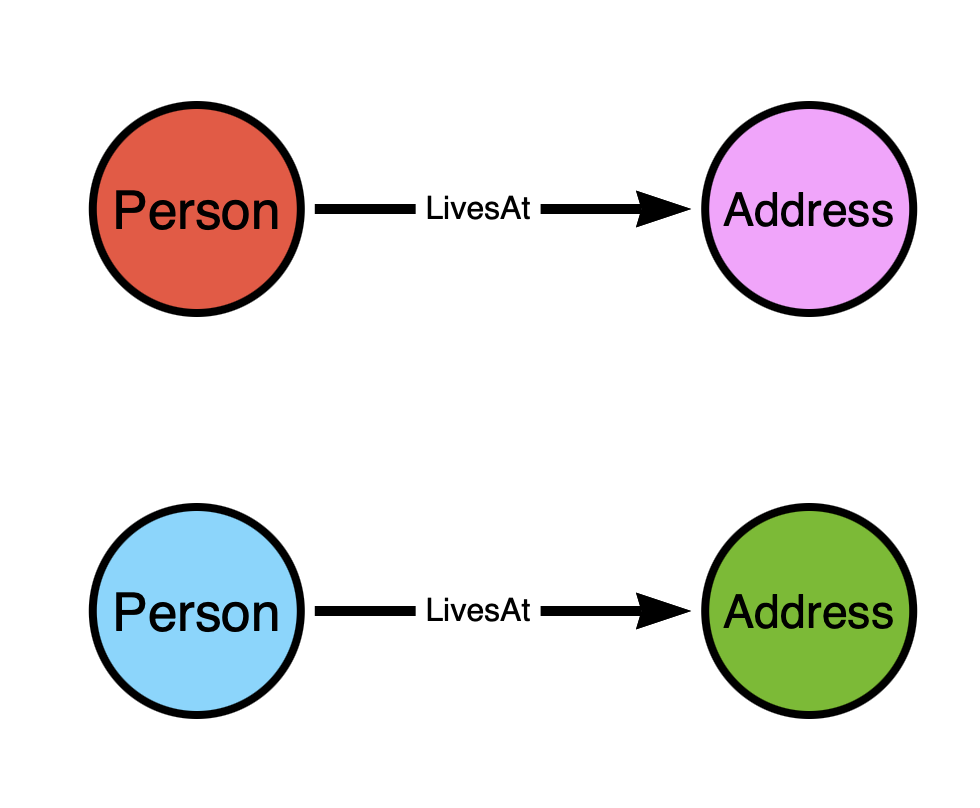
Let’s belabor the point a little more to make it even more clear. The top model would be analogous to having a node represent both a person and the address where they live, with the edge representing the fact that they live at that address:
Now is there a path from the red (top left) node to the blue (bottom left) node? Yes! It goes through the green (bottom right) node!
The difference in the two graphs is the level of connectedness, or how well-linked the nodes are to one another.
Let’s belabor the point a little more to make it even more clear. The top model would be analogous to having a node represent both a person and the address where they live, with the edge representing the fact that they live at that address:
 While the bottom graph would be analogous to having the nodes represent the addresses and the edges represent streets:
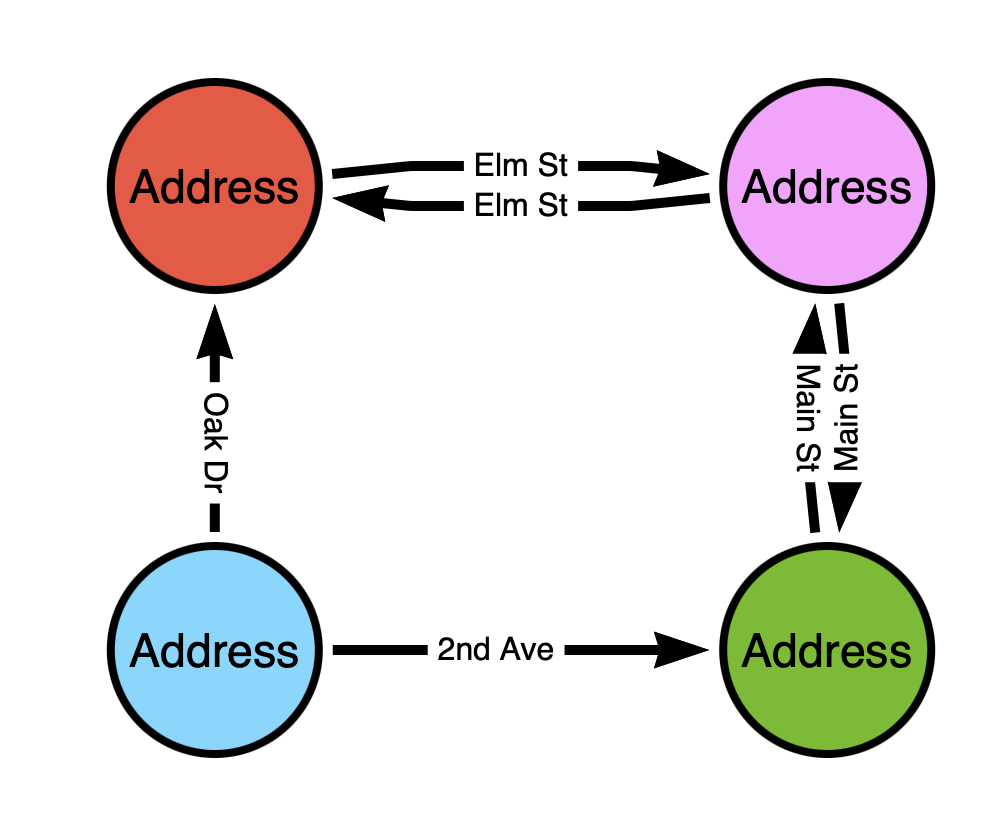 It should be obvious that for the sake of pathfinding, the second model is the only model that will work.
This is actually how Google Maps works under the hood – it is a graph where locations are nodes and streets are edges.
It should be obvious that for the sake of pathfinding, the second model is the only model that will work.
This is actually how Google Maps works under the hood – it is a graph where locations are nodes and streets are edges.
This article is adapted from Andy Robbins’ blog post, “Attack Graph Model Design Requirements and Examples,” which goes beyond what’s described here.