- Use the dashboards to track the Active Directory and Azure attack paths of your environment
- Create alerts to detect when new attack paths emerge or exposure increases
- Enrich your security information and event management (SIEM) data with information about the attack paths to and from principals in your environment
Prerequisites
Before you begin the installation and configuration process, ensure the following prerequisites are met:- Splunk instance (version 9.0.1 or later) and an admin account
- BloodHound Enterprise tenant
- BloodHound Enterprise non-personal API key/ID pair with the Auditor role
Install the app
Installing the BloodHound Enterprise Splunk app involves the following steps:Navigate to Splunk app management
- Log in to Splunk Enterprise as an admin.
- Click Apps > Manage apps.
Install the BloodHound Enterprise Splunk app
Use one of the following methods to install the BloodHound Enterprise Splunk app:
- Splunkbase
- Downloaded package
Install directly from Splunkbase:
- Click Browse More Apps.
- Search for BloodHound Enterprise.
- Click Install
- Enter your Splunkbase credentials to authorize the download when prompted.
Configure the app (required)
This section describes the minimum required configuration steps to get the BloodHound Enterprise Splunk app up and running. It involves the following steps:- Configure a Splunk index
- Configure Splunk app API credentials
- Configure Splunk data inputs
Optional configurations are available in the Configure the Splunk app (optional) section.
Configure a Splunk index
Create a dedicated index for the BloodHound Enterprise Splunk app data:
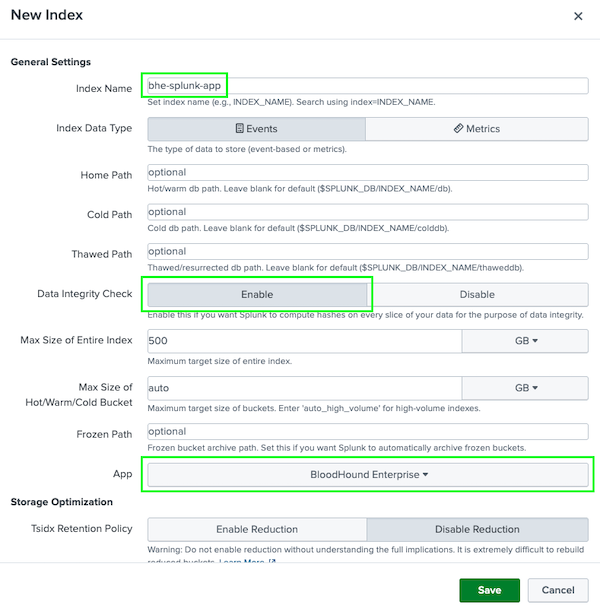
- Click Settings > Indexes > New Index.
-
In the Index Name field, enter
bhe-splunk-app. - In the Data Integrity Check field, select Enabled.
- In the App field, select BloodHound Enterprise.
-
Click Save.
Configure Splunk app API credentials
Configure the BloodHound Enterprise Splunk app with your BloodHound Enterprise API credentials.
We recommend a non-personal API key/ID pair with the Auditor role for the Splunk integration.
- Click Apps > Manage Apps.
- Filter for the BloodHound Enterprise Splunk app and click on it.
- Click the Administration drop-down menu and select Configuration.
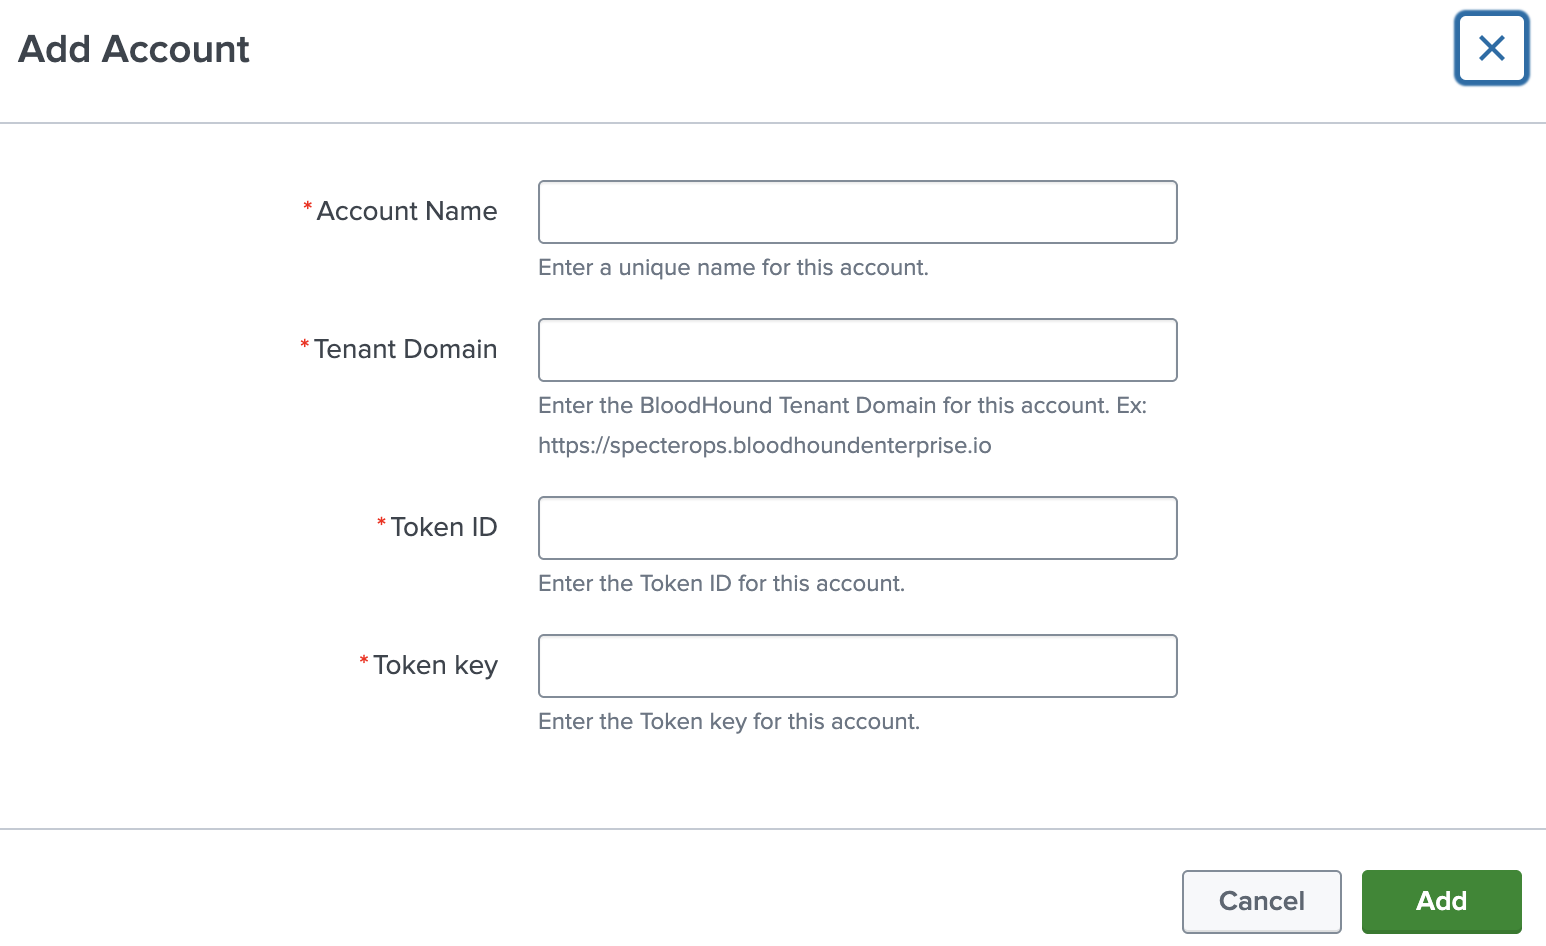
- Click Add to open the Add Account screen.
-
Complete the configuration fields:
Field Description Account Name Unique name to identify the BloodHound Enterprise account in Splunk Tenant Domain Your BloodHound Enterprise tenant (e.g., https://mydomain.bloodhoundenterprise.io)Token ID Token ID associated with the BloodHound Enterprise account Token key Token key associated with the BloodHound Enterprise account -
Click Save to apply the configuration.
Configure data inputs
Data inputs define what data the BloodHound Enterprise Splunk app collects from the BloodHound Enterprise API.
- Click Apps > Manage Apps.
- Filter for the BloodHound Enterprise Splunk app and click on it.
- Click the Administration drop-down menu and select Inputs.
- Click Create New Input.
-
Select an input type from the drop-down menu.
The BloodHound Enterprise Splunk app supports the following input types:
Input type Description Attack Paths Retrieves a list of attack paths from the BloodHound Enterprise API and a list of various findings across a given time range. Audit Logs Retrieves a list of audit logs from the BloodHound Enterprise API. - Requires the API user to have either the Administrator or Auditor role in BHE.
- You can set the “Historical Polling Days” field to retrieve logs from the past N days, starting from the current date.
- After the app fetches all logs for the specified period, the input continues polling only the latest audit logs.
- If you need logs from a different time range, you can create a new input and fetch them separately.
Tier Zero Assets Ingests data for all asset members that belong to the Tier Zero privilege zone. Posture Statistics Retrieves a history of statistics stored in the database using the BloodHound Enterprise API. -
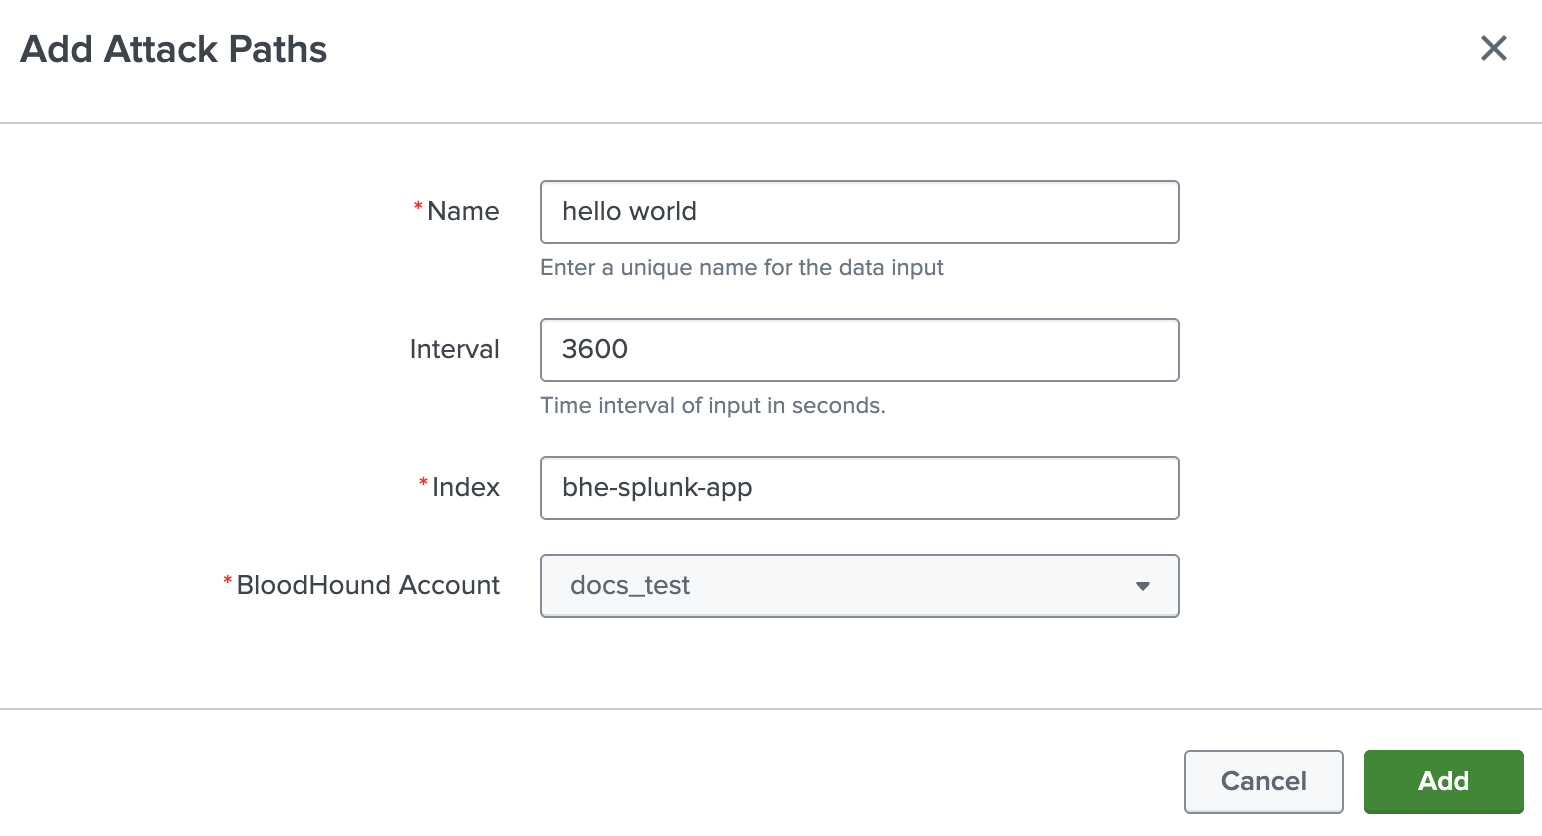
Complete the configuration fields for the selected input type.
The following table describes fields that are common across all input types:
Field Description Name Unique name identifying the input Interval Interval (in seconds) at which the input runs Index Index where the BloodHound Enterprise data is stored ( bhe-splunk-app). You must clear thedefaultvalue and search for the correct index.Bloodhound Account BloodHound Enterprise account name (configured in Splunk) that will be used to fetch the data -
Click Add to create the input.
Repeat the above steps to create additional inputs as needed. Data will now begin flowing into the environment. You can monitor this progress through Splunk itself with the following query:
Configure the app (optional)
This section describes optional configuration options for the BloodHound Enterprise Splunk app, including:- Configure a Splunk search macro
- Configure a Splunk proxy
- Configure Splunk logging
Configure search macro
The BloodHound Enterprise Splunk app includes a search macro (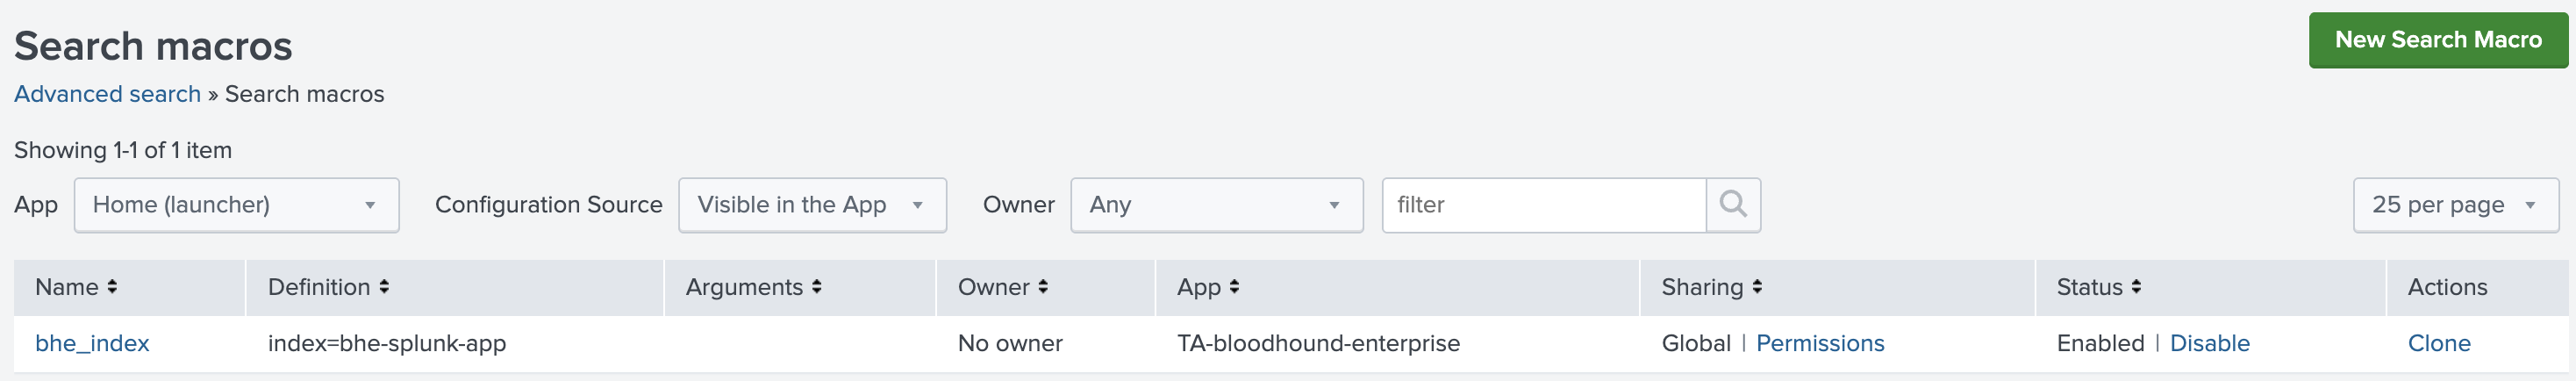
bhe_index) that points to the default index where Splunk stores BloodHound Enterprise data (bhe-splunk-app).- Click Settings > Advanced search.
- Click Search macros.
-
Filter for
bhe_index. If you used a different index name, edit the macro Definition field to match that name.If you maintain separate indexes per input type, modify the macro definition accordingly. For example:
Configure a proxy
Splunk allows you to configure a proxy to route traffic through an intermediary server. This might be useful for network security and compliance requirements.
- Click Apps > Manage Apps.
- Filter for the BloodHound Enterprise Splunk app and click on it.
- Click the Administration drop-down menu and select Configuration.
- Click the Proxy Settings tab.
-
Complete the configuration fields:
Field Description Enable Checkbox to enable or disable the proxy configuration Proxy Type Drop-down to choose the type of proxy (http, socks4, socks5) Host Enter the proxy hostname or IP address Port Specify the port number (e.g., 8080) Username If authentication is required, enter the username Password If authentication is required, enter the corresponding password - Click Save to apply the proxy settings.
- Restart Splunk.
Configure logging
You can configure logging settings for the BloodHound Enterprise Splunk app to help with troubleshooting and monitoring.You can search logs in Splunk using:Use the
- Click Apps > Manage Apps.
- Filter for the BloodHound Enterprise Splunk app and click on it.
- Click the Administration drop-down menu and select Configuration.
- Click the Logging tab.
-
Select one of the following options from the Log level drop-down menu:
Log level Description DEBUG Most verbose; use for troubleshooting INFO Standard logs (default) WARNING Warnings only ERROR Errors only - Click Save to apply the changes.
tail command to monitor logs in real-time:Monitor and troubleshoot
The BHE Integration Health dashboard is designed to help you monitor and troubleshoot errors related to the BloodHound Enterprise Splunk app. This dashboard provides real-time insights into the system failures, allowing you to quickly identify and resolve issues. It retrieves and displays error logs with the following Splunk query:This dashboard does not provide filters.
- Identify the function causing the error in the Detailed Error Logs table
- Look for recurring errors in Error Summary and Top Error Functions
- Apply the relevant steps above based on the error type
- If issues persist, inspect Splunk internal logs
See Troubleshooting for common issues and resolutions.
- Log in to Splunk Enterprise as an admin.
- Click Apps > Manage apps.
- Filter for the BloodHound Enterprise Splunk app and click on it.
- Click the Administration drop-down menu and select BHE Integration Health Dashboard.
Error Trend Over Time
This panel shows which functions are generating the most errors in the BloodHound Enterprise Splunk app.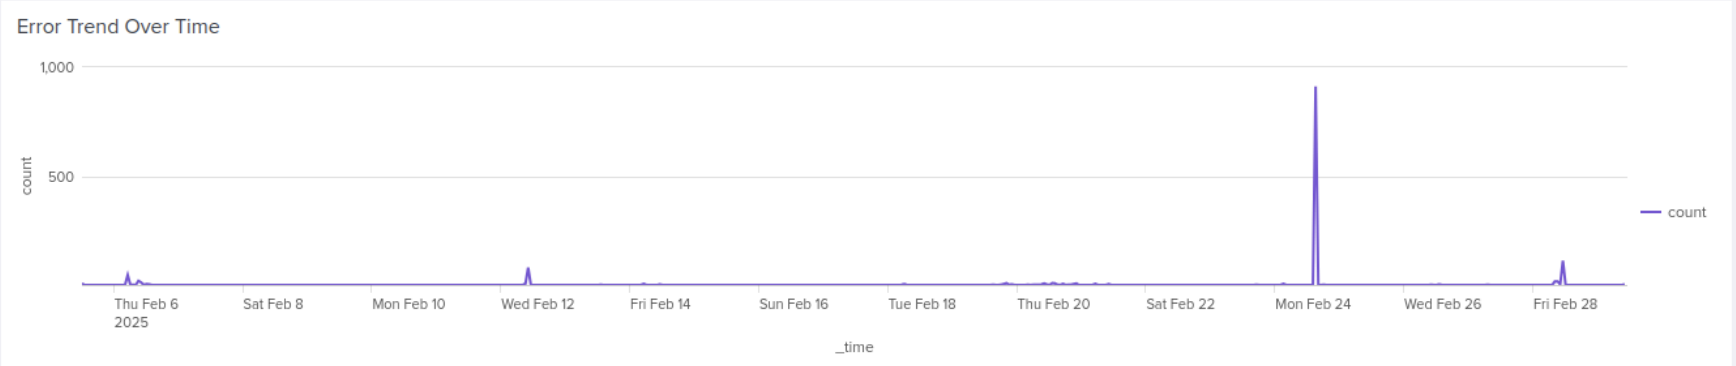
Errors by Function
This panel shows a chart of errors (by function) generating errors in the BloodHound Enterprise Splunk app.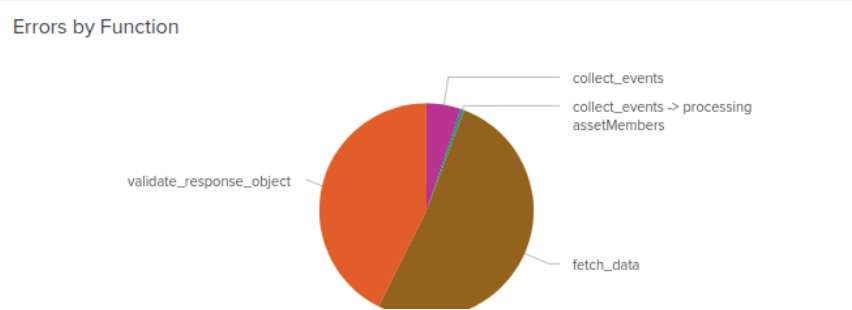
Top 10 Frequent Errors
This panel shows a chart of the top ten most frequent error messages occurring in the BloodHound Enterprise Splunk app.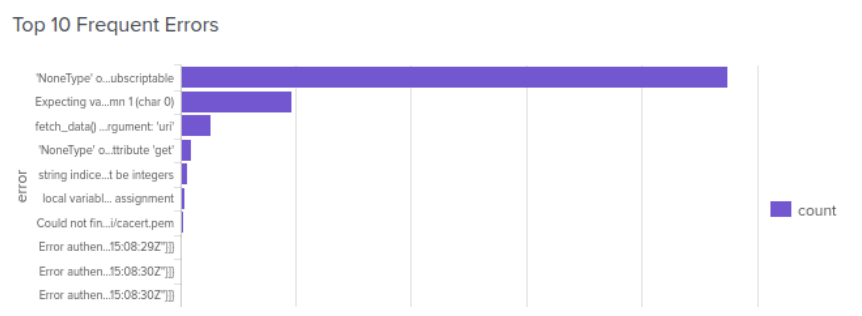
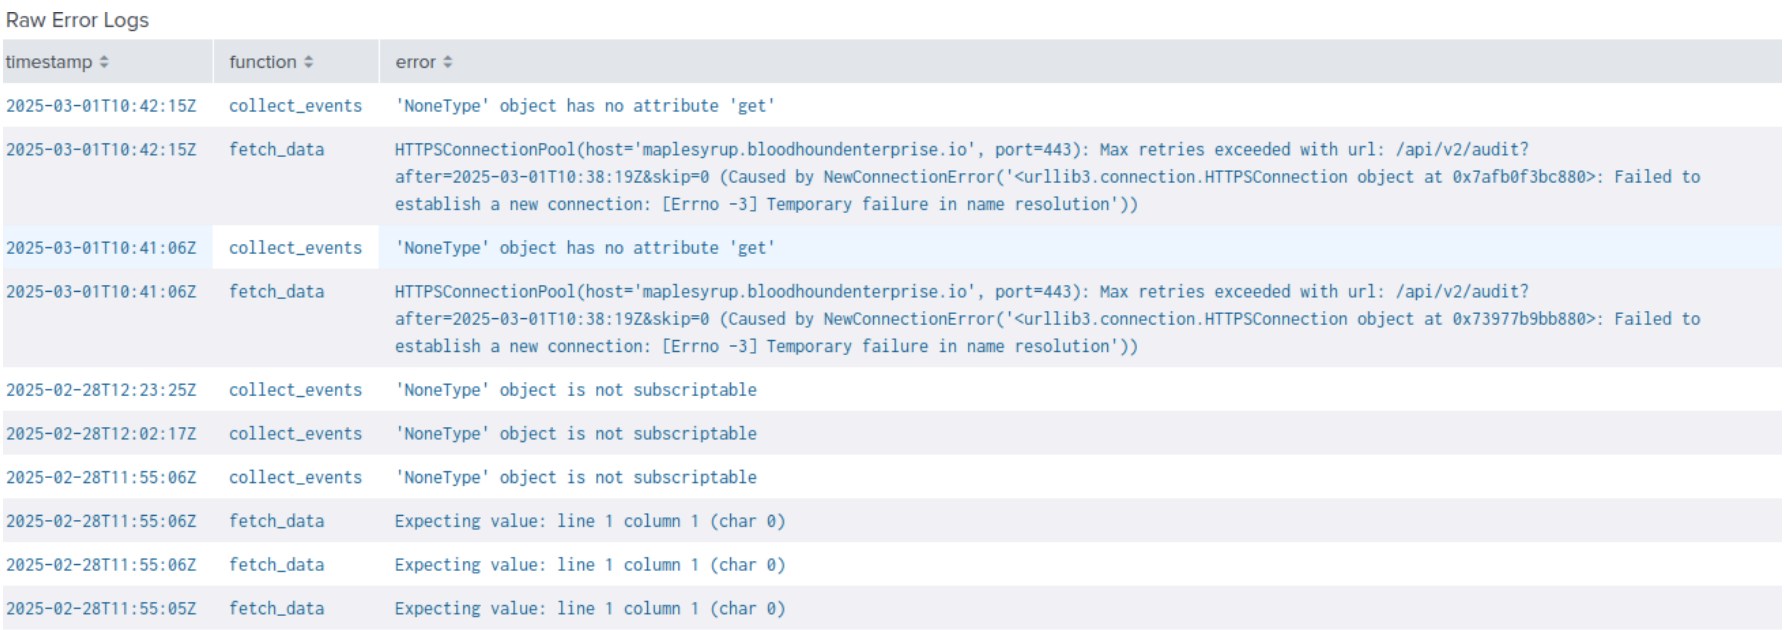
Raw Error Logs
This panel provides a detailed table of raw error logs generated by the BloodHound Enterprise, including timestamps, function names, and error messages.