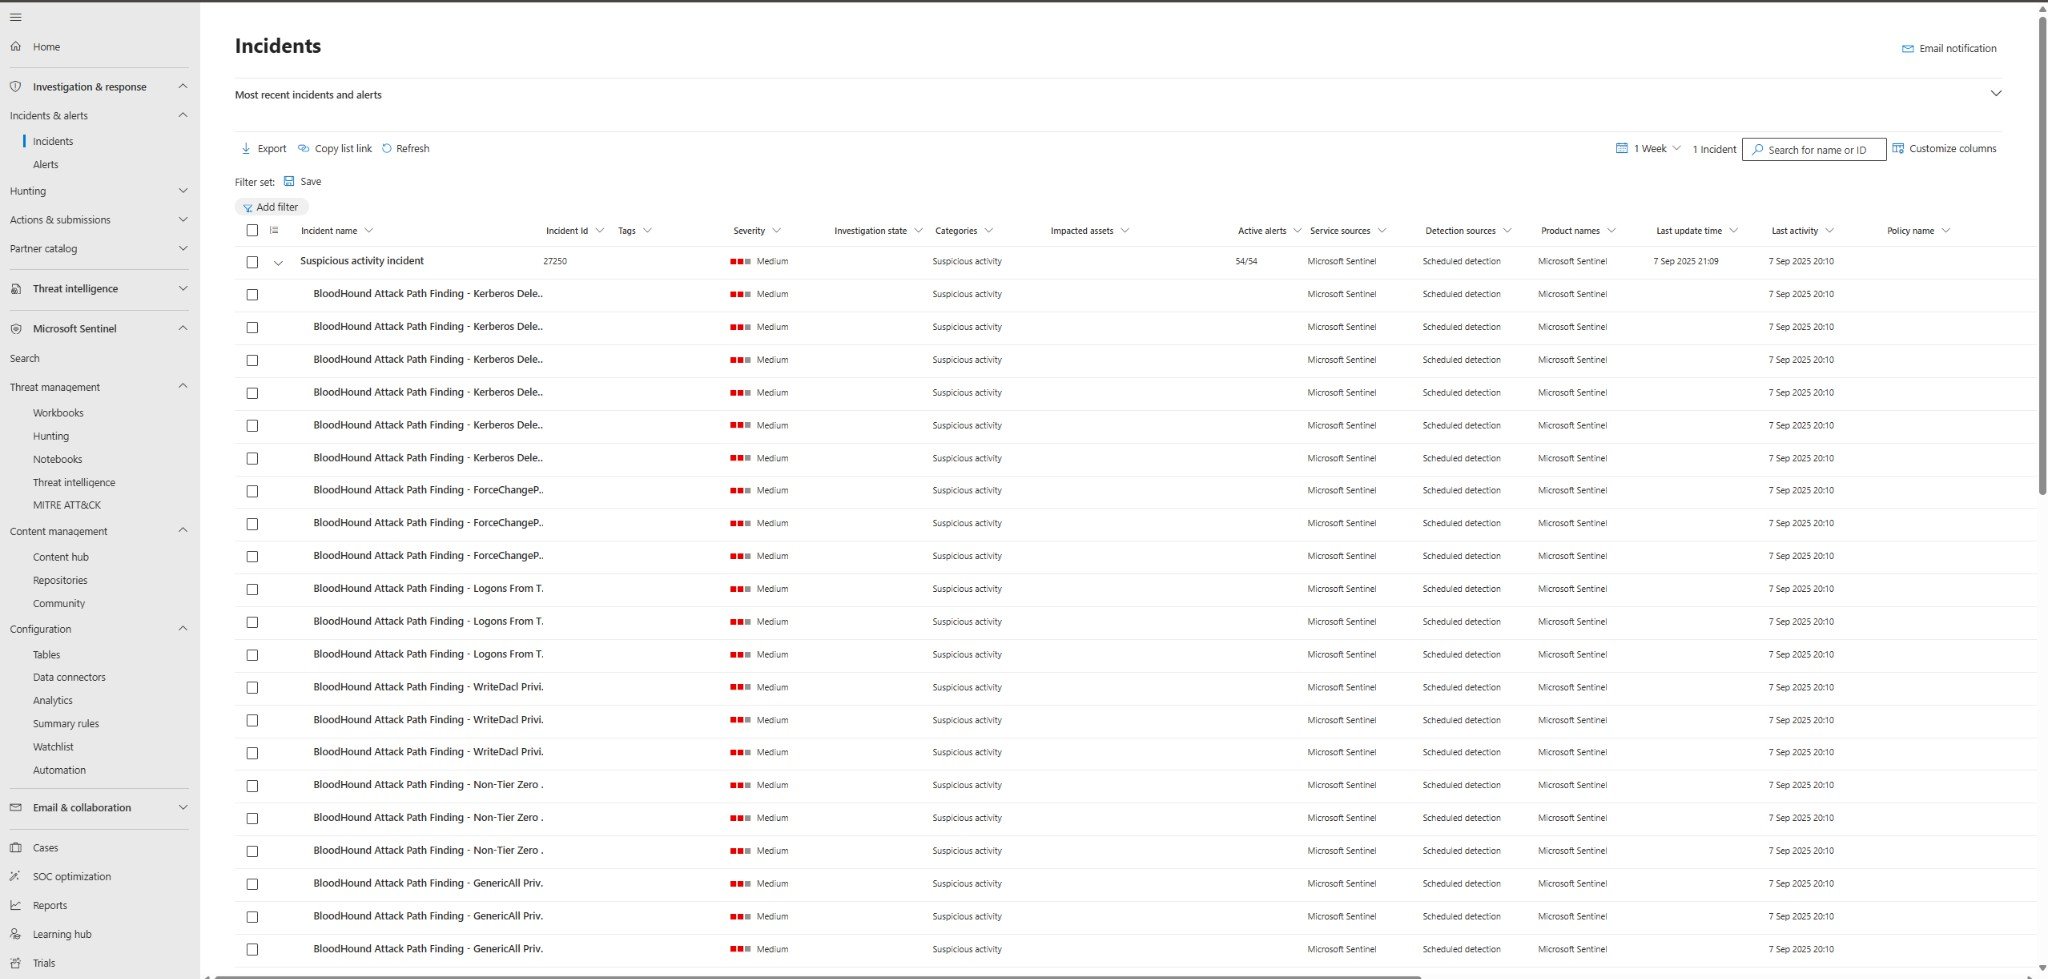
 The Microsoft Sentinel integration for BloodHound Enterprise enables security teams to ingest attack path data, audit logs, posture trends, and Tier Zero asset exposure into Microsoft Sentinel for centralized monitoring, investigation, and response.
It’s available as a data connector that can be deployed to your Azure environment, with pre-built workbooks (dashboards) and analytics rules to visualize and act on the data.
The Microsoft Sentinel integration for BloodHound Enterprise enables security teams to ingest attack path data, audit logs, posture trends, and Tier Zero asset exposure into Microsoft Sentinel for centralized monitoring, investigation, and response.
It’s available as a data connector that can be deployed to your Azure environment, with pre-built workbooks (dashboards) and analytics rules to visualize and act on the data.
Roles and permissions
To successfully deploy and use the Microsoft Sentinel integration, different Azure roles and permissions are required for various personas involved in the process. The following table outlines the key roles, their responsibilities, and the required permissions for each role:Prerequisites
Before you begin the installation and configuration process, ensure the following prerequisites are met:- Active Azure subscription with permissions to deploy resources
- Microsoft Sentinel workspace (Log Analytics Workspace) in a target resource group
- BloodHound Enterprise tenant
- BloodHound Enterprise non-personal API key/ID pair
- Microsoft Entra ID application with the Monitoring Metrics Publisher role on the target resource group
Configure the integration
Follow the steps below to deploy and configure the Microsoft Sentinel integration for BloodHound Enterprise. This process involves deploying Azure resources, configuring authentication, and setting up data ingestion.1
Create a Log Analytics Workspace
Create a Log Analytics Workspace to store the data ingested from BloodHound Enterprise. This workspace will be connected to Microsoft Sentinel for monitoring and analysis.
- Log in to the Azure Portal with an account that has the necessary permissions for Microsoft Sentinel and Log Analytics Workspace configurations.
- Navigate to the Log Analytics Workspace and click Create.
-
Select subscription and resource group, then enter a workspace name.
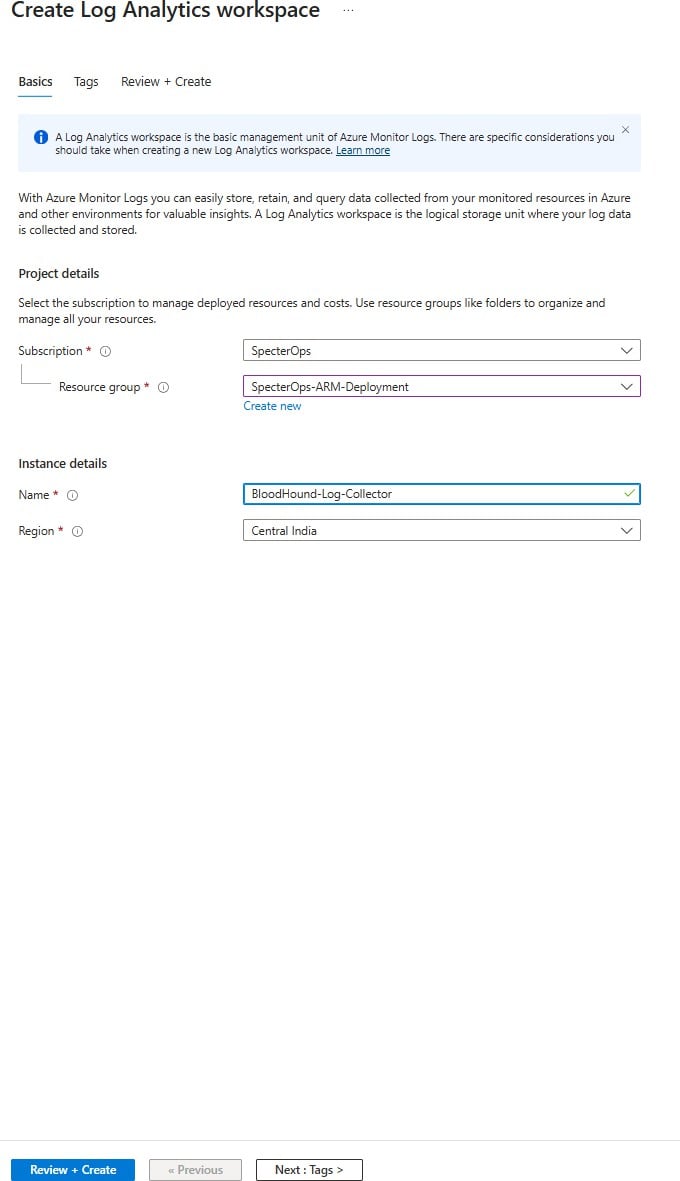
- Click Review + create.
-
Add the Log Analytics Workspace in Sentinel:
- Navigate to Sentinel.
- Click Create.
- Select the newly created Log Analytics Workspace.
- Click Add.
2
Register a Microsoft Entra ID application
Register a Microsoft Entra ID application to authenticate the data connector with Microsoft Sentinel. This application will be granted the necessary permissions to publish data to Sentinel.
- Open Microsoft Entra ID.
- Go to App registrations > New registration.
-
Enter an app name and choose Accounts in this organizational directory only. No redirect URI is necessary.
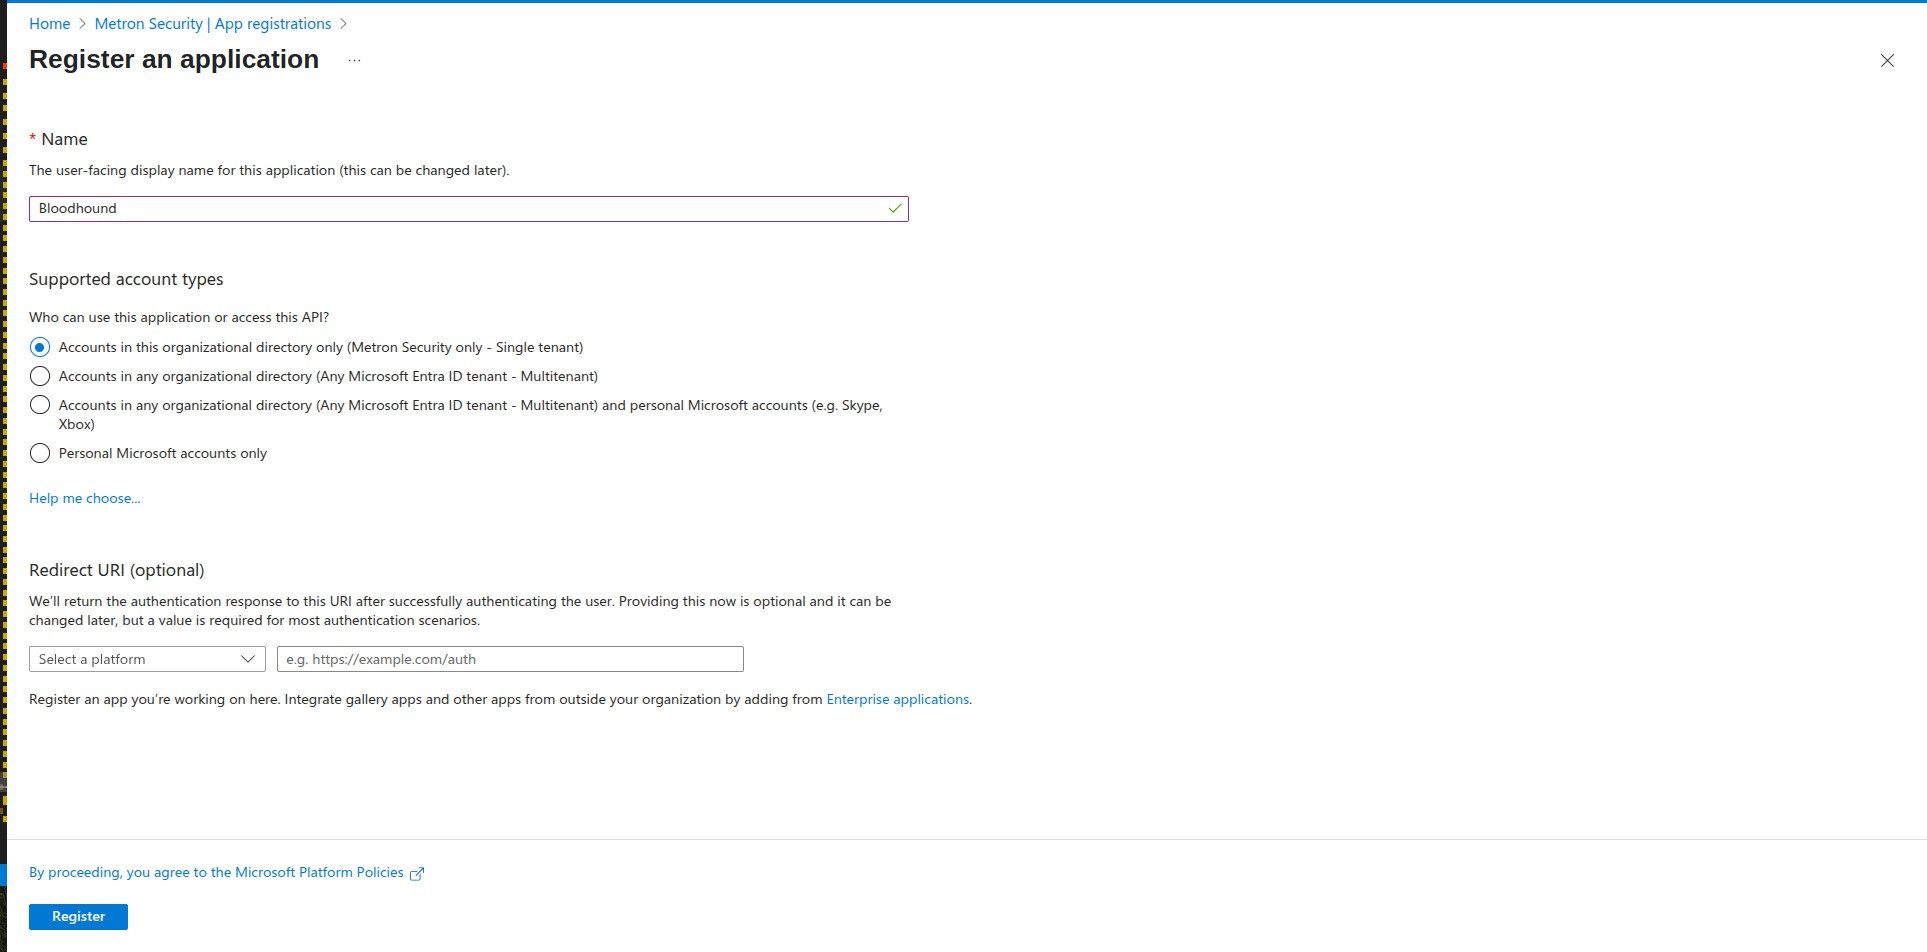
- Click Register.
- Copy the Application (client) ID and Directory (tenant) ID. You’ll need these later.
- Under Certificates & secrets, create a client secret and save its value immediately. It will not be shown again.
3
Assign required Azure role to the app
Assign the Monitoring Metrics Publisher role to the Microsoft Entra ID application on your resource group:
- Open your resource group.
- Go to Access control (IAM) > Add role assignment.
- Assign Monitoring Metrics Publisher to the Entra application.
- Select a user, group, or service principal to assign access to, then click Select members.
- Select the application that you created, then click Select.
- Click Review + Assign.
4
Install the solution from Microsoft Marketplace
Install the BloodHound Enterprise Microsoft Sentinel solution from Microsoft Marketplace. The solution package installs the workbooks, analytics-rule templates, and data connector content; you do not need to deploy the solution package from a GitHub-hosted ARM template.
- In the Azure Portal, open the Log Analytics workspace you created and note its name and location. You will need this information during installation.
- Open the BloodHound Enterprise Microsoft Sentinel solution in Microsoft Marketplace.
- Select Get it now. You will be redirected to the Azure Portal.
- Select Create to begin the installation.
- Select the target subscription and resource group, then provide the requested deployment parameters, including the Log Analytics workspace name and location.
- Select Review + create, then select Create to install the solution.
5
Verify the solution content
Verify that the Marketplace installation added the BloodHound workbook, analytics-rule, and data connector content before configuring the data connector:
- In the Azure Portal, open Microsoft Sentinel and select the workspace where you installed the solution.
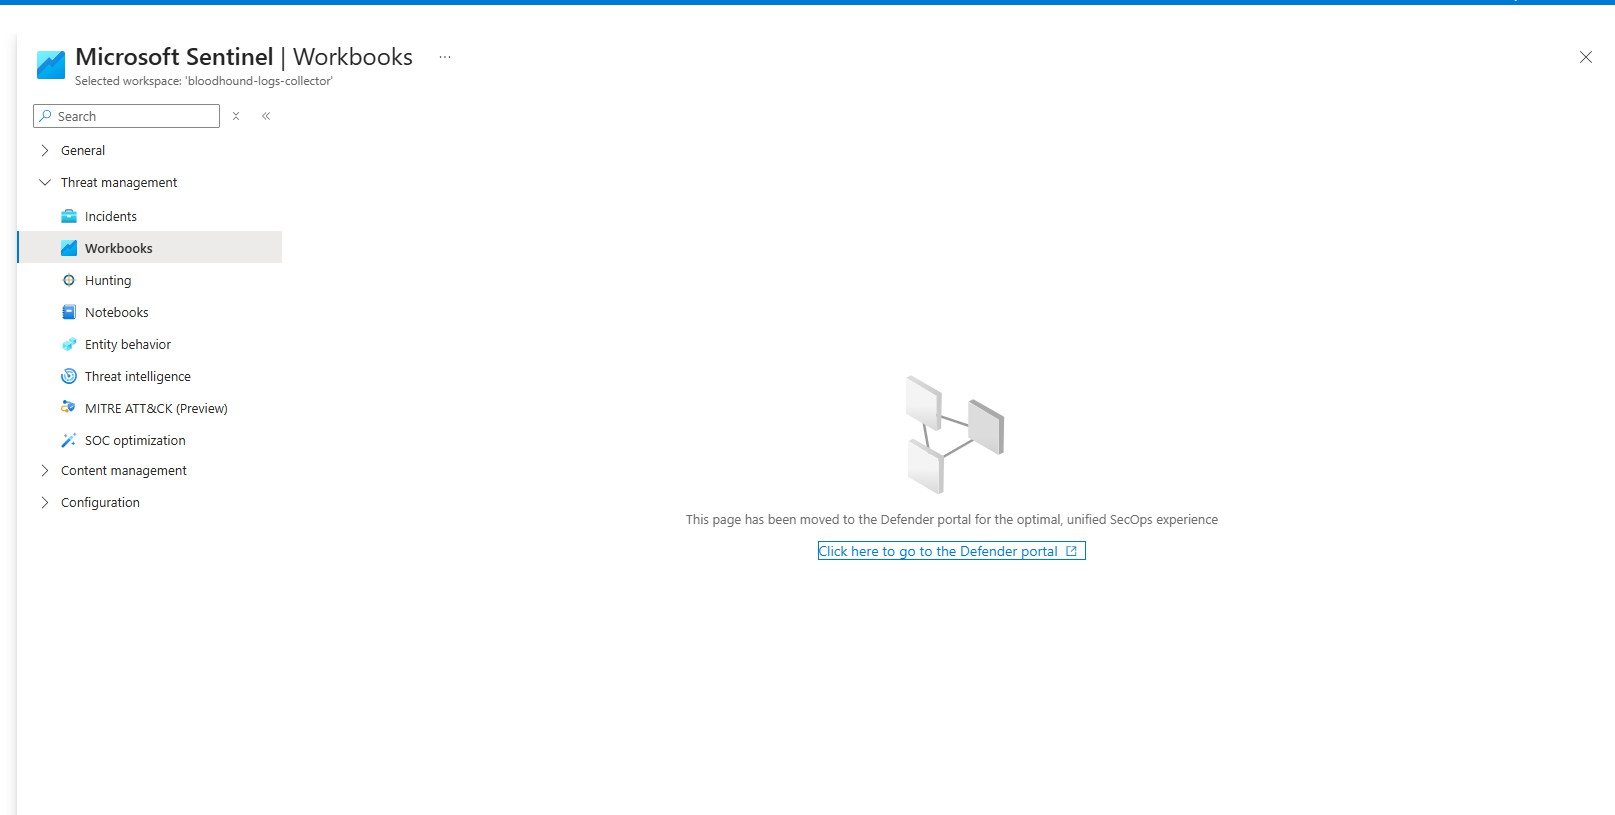
- Go to Workbooks under Threat management.
-
If prompted to continue in Microsoft Defender, select the link to open Microsoft Defender portal.
-
If multiple Sentinel workspaces are available, select the integration workspace from the workspace selector in the top-right corner.
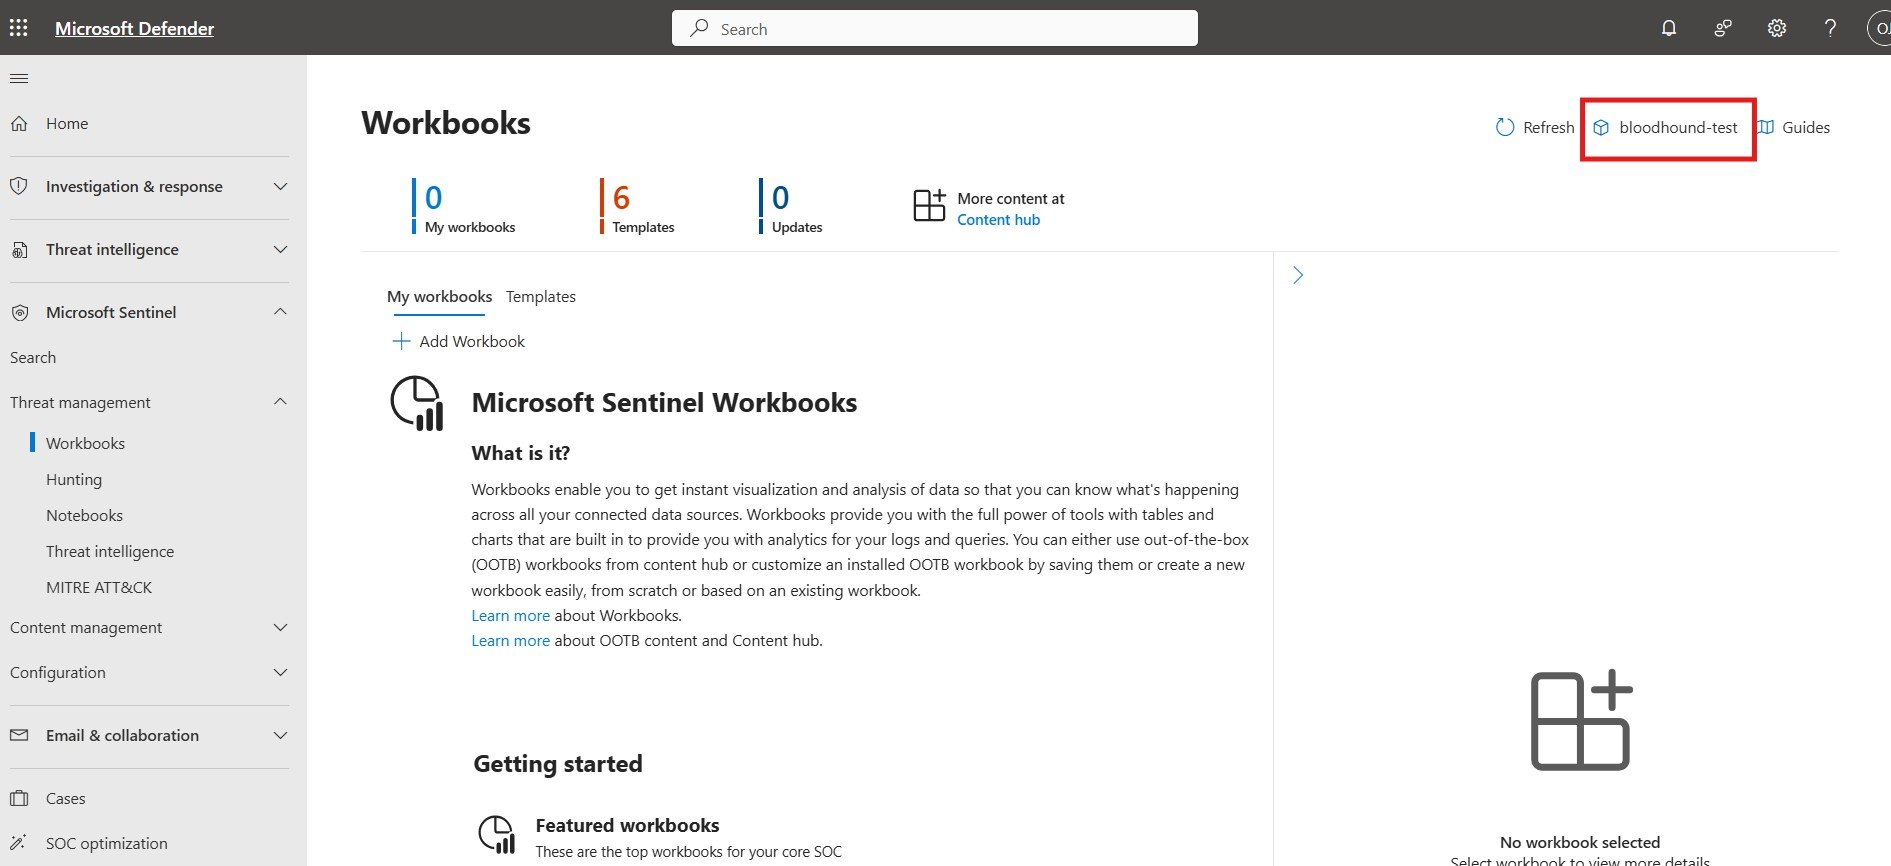
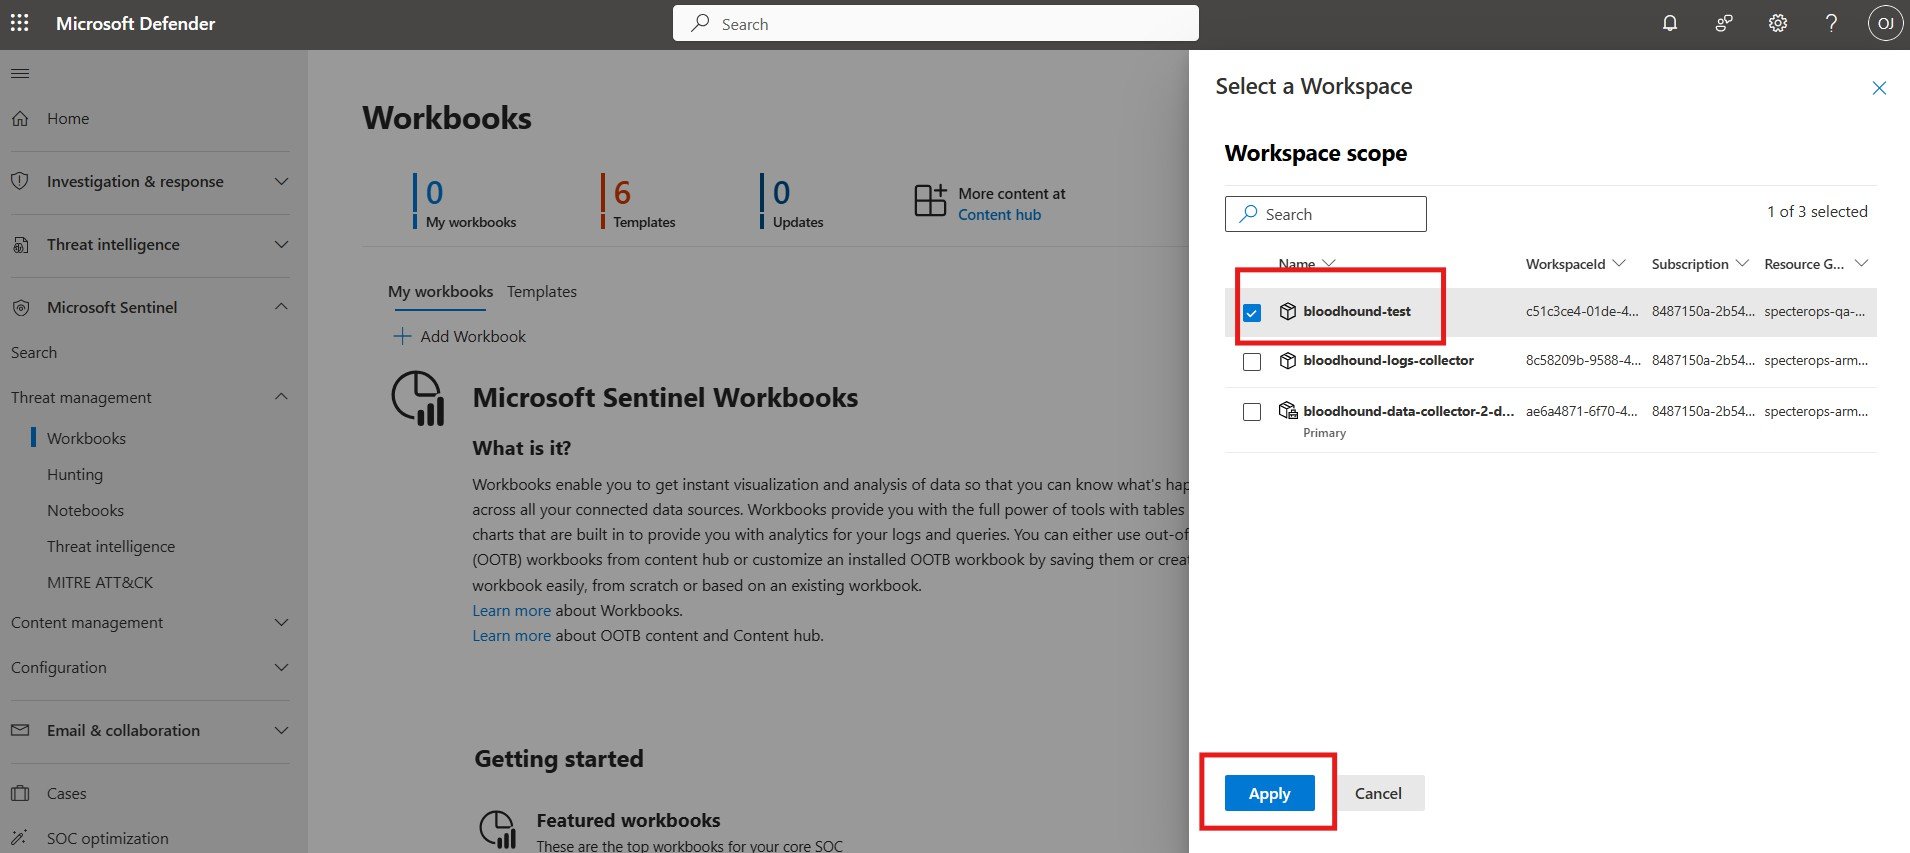
-
In Workbooks, open the Templates tab and verify the BloodHound workbook templates are available.
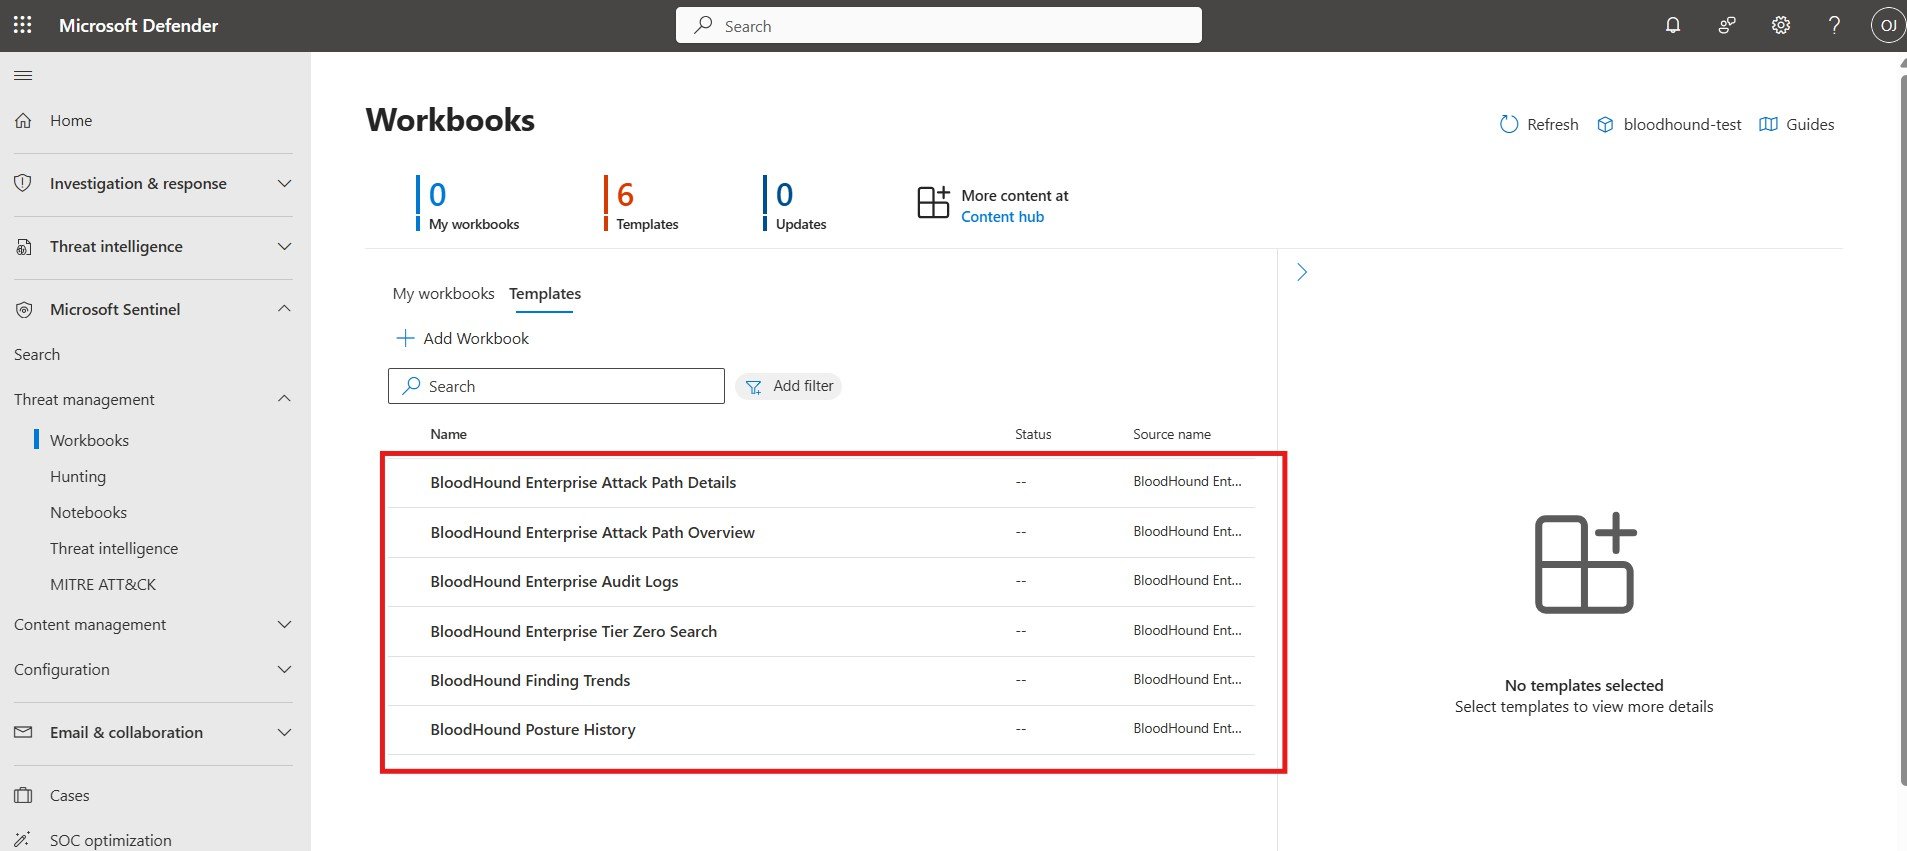
-
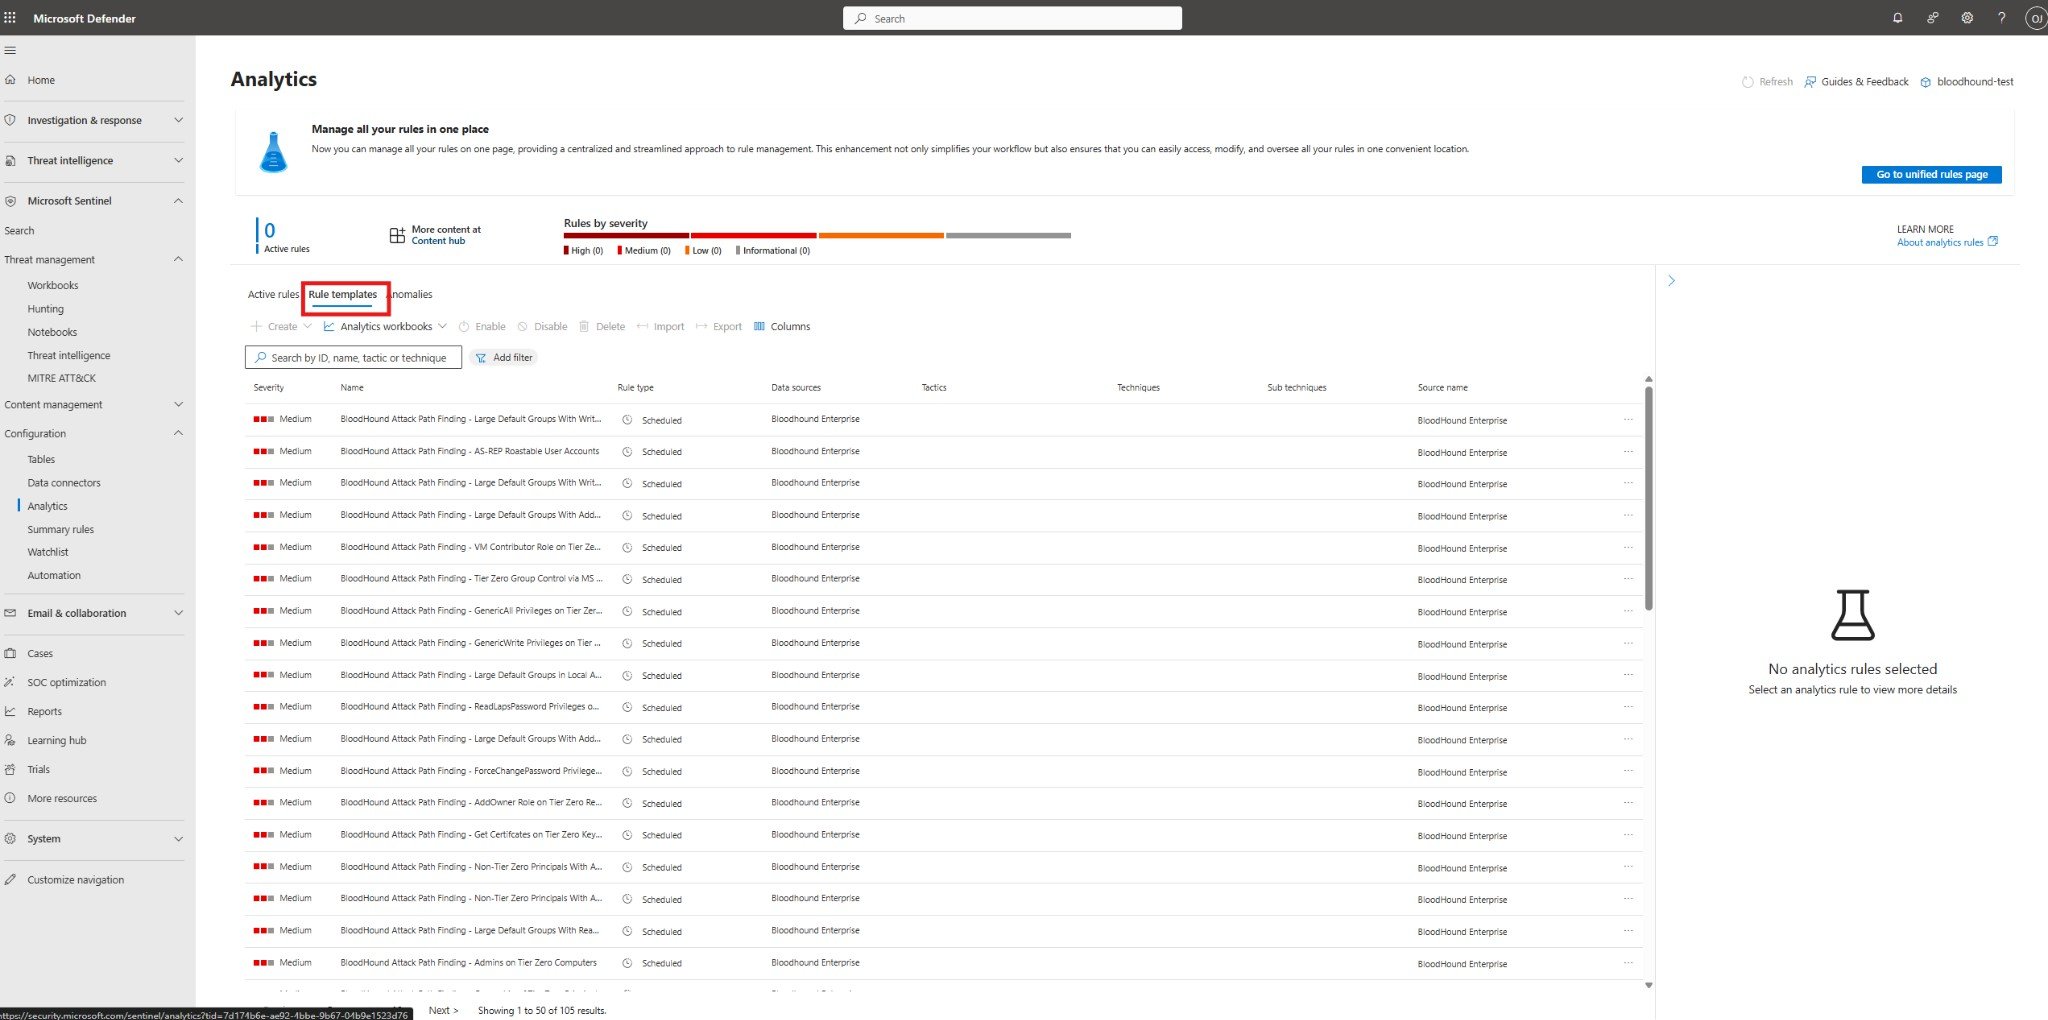
Go to Configuration > Analytics > Rule templates and verify the BloodHound analytics rules are available.
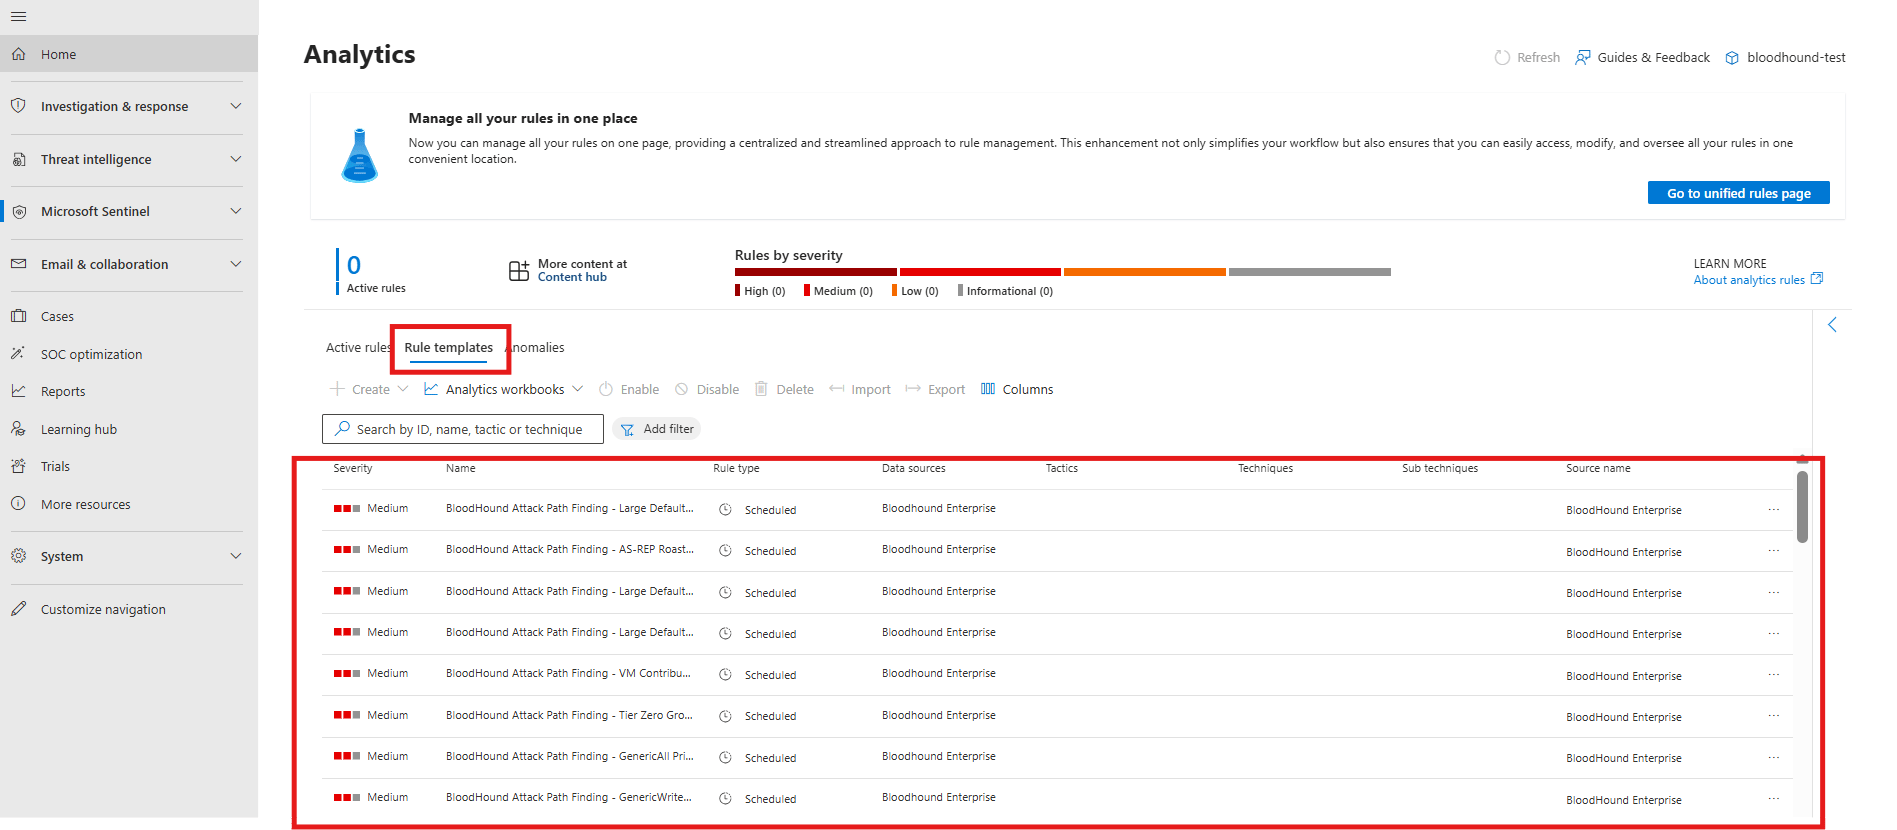
-
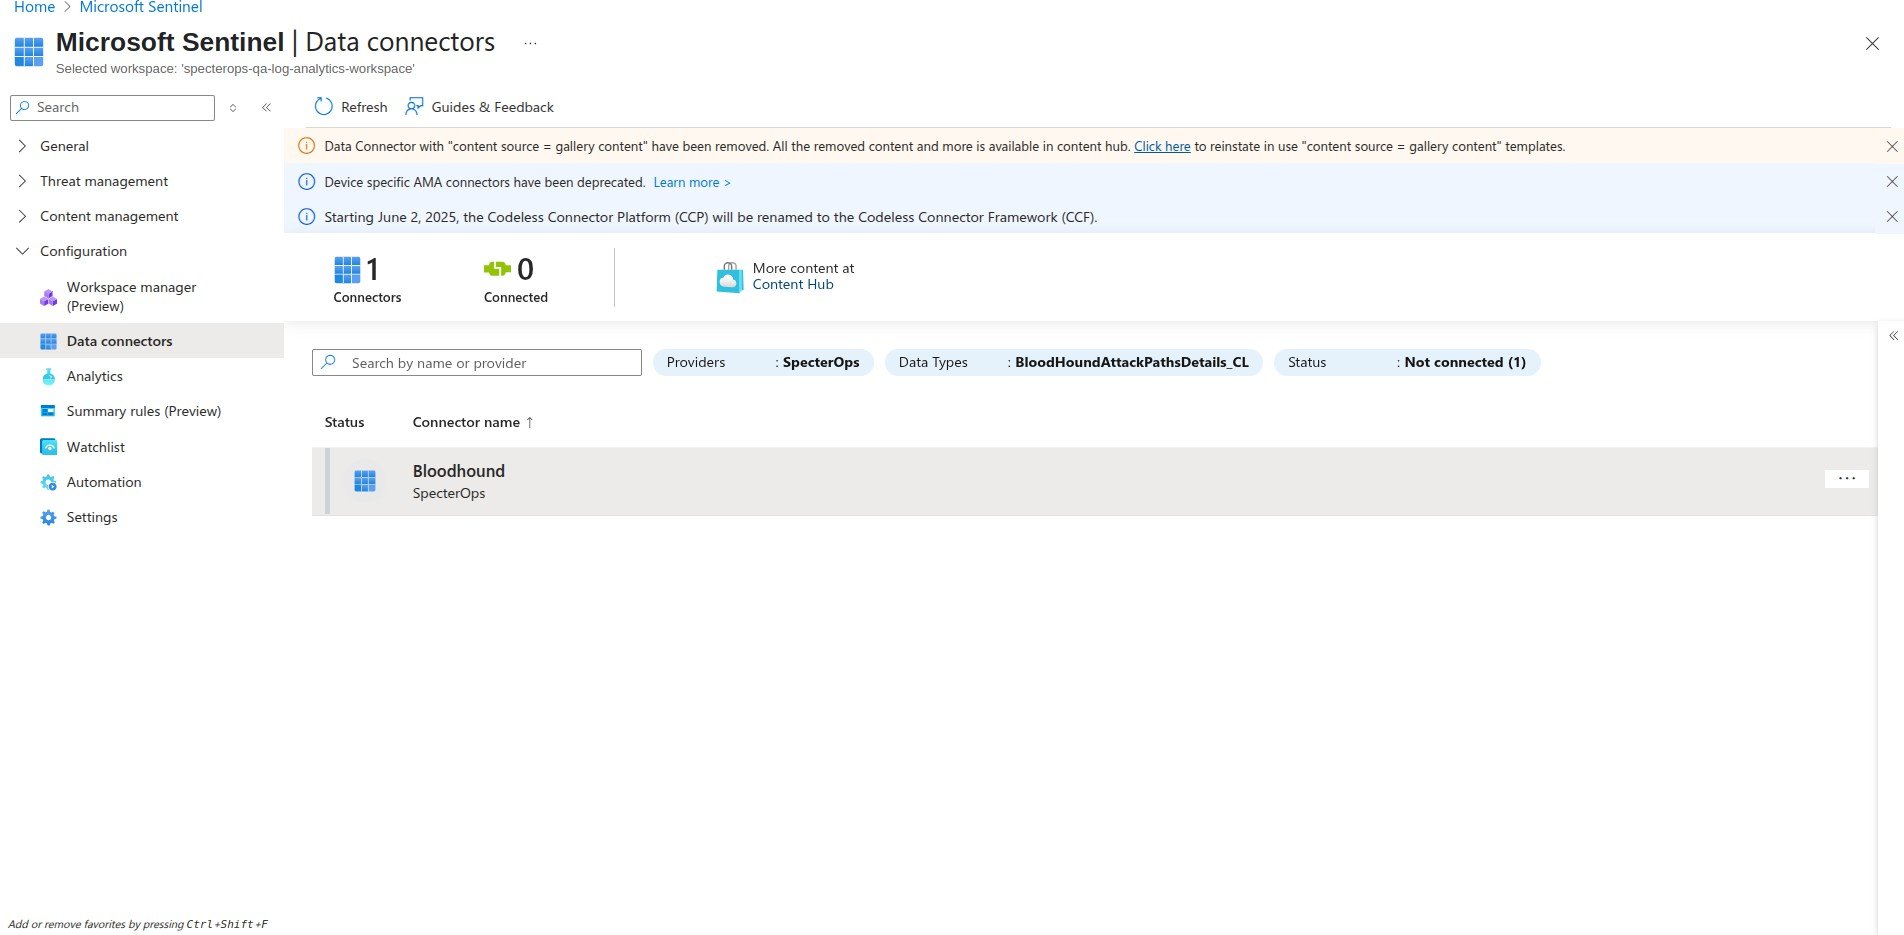
Go to Configuration > Data connectors and verify the BloodHound Data Connector is listed. You will configure and connect it in the next step.
6
Deploy the data connector
Deploy the BloodHound Enterprise data connector from the Marketplace-installed solution. This deployment creates the Azure Function App, Data Collection Endpoint (DCE), Data Collection Rule (DCR), custom tables, and supporting resources.
- Log in to the Azure Portal with an account that has the Owner role on the resource group.
- In Microsoft Sentinel, select the workspace where you installed the solution.
- Go to Content management > Content hub, select BloodHound Enterprise, then select Manage.
- Select BloodHound Enterprise Data Connector (using Azure Functions), then select Open connector page.
- Review the connector instructions, then select Deploy to Azure to open its deployment page.
7
Configure data connector parameters
Fill in the data connector deployment parameters:
- Select the target subscription and resource group, then enter the workspace name, workspace location, and the remaining required parameters.
- Click Review + create.
- Click Create to deploy the data connector resources.
8
Verify the data connector deployment
After deploying the data connector, manually run each function to verify that it can fetch data from BloodHound Enterprise and write it to the custom tables in your Log Analytics workspace.
-
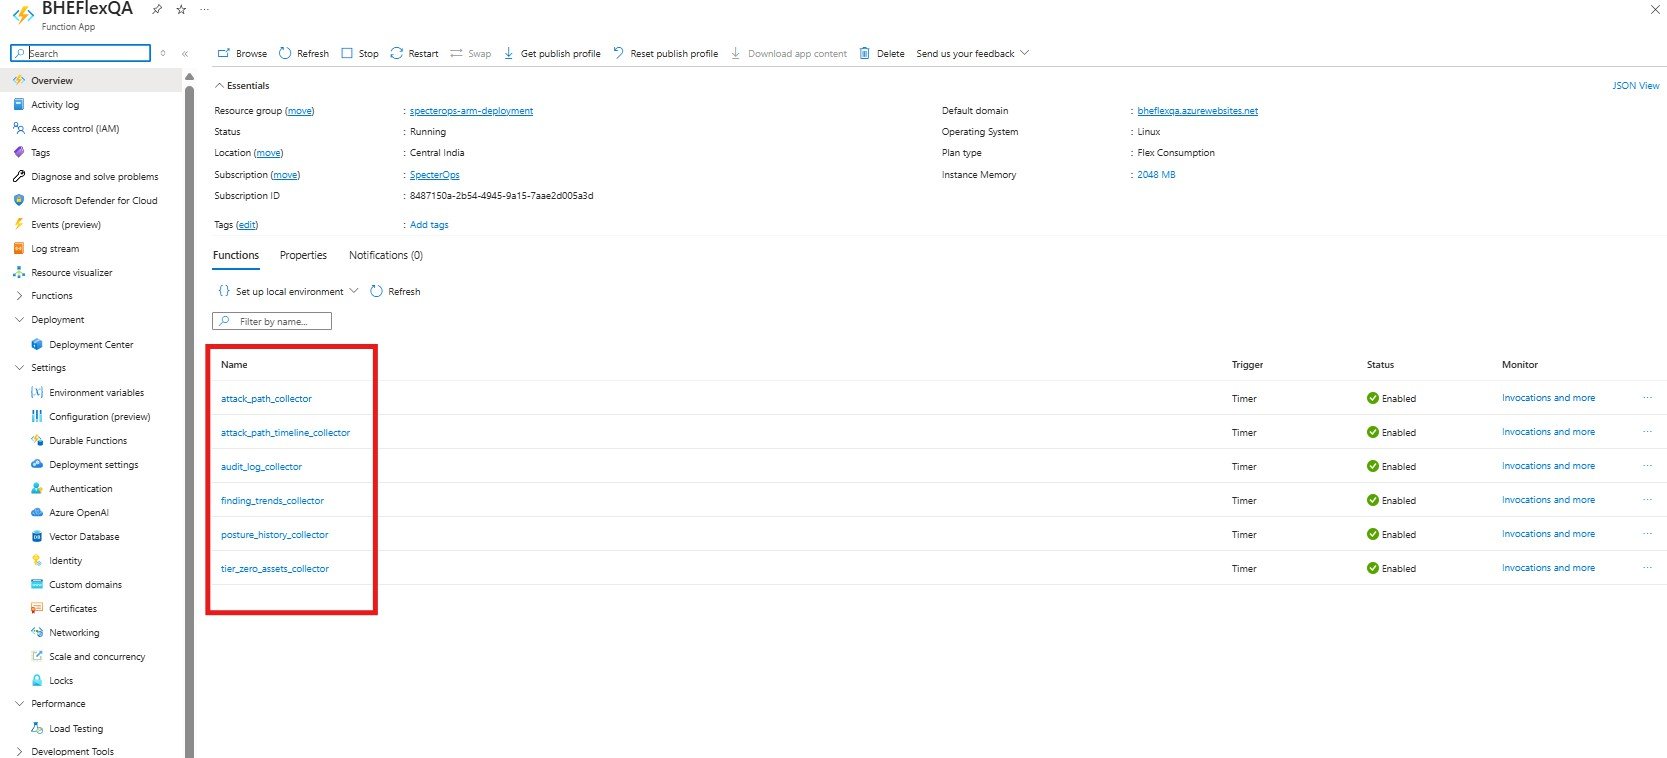
Navigate to the Overview page of your Function App and select one of the deployed functions.
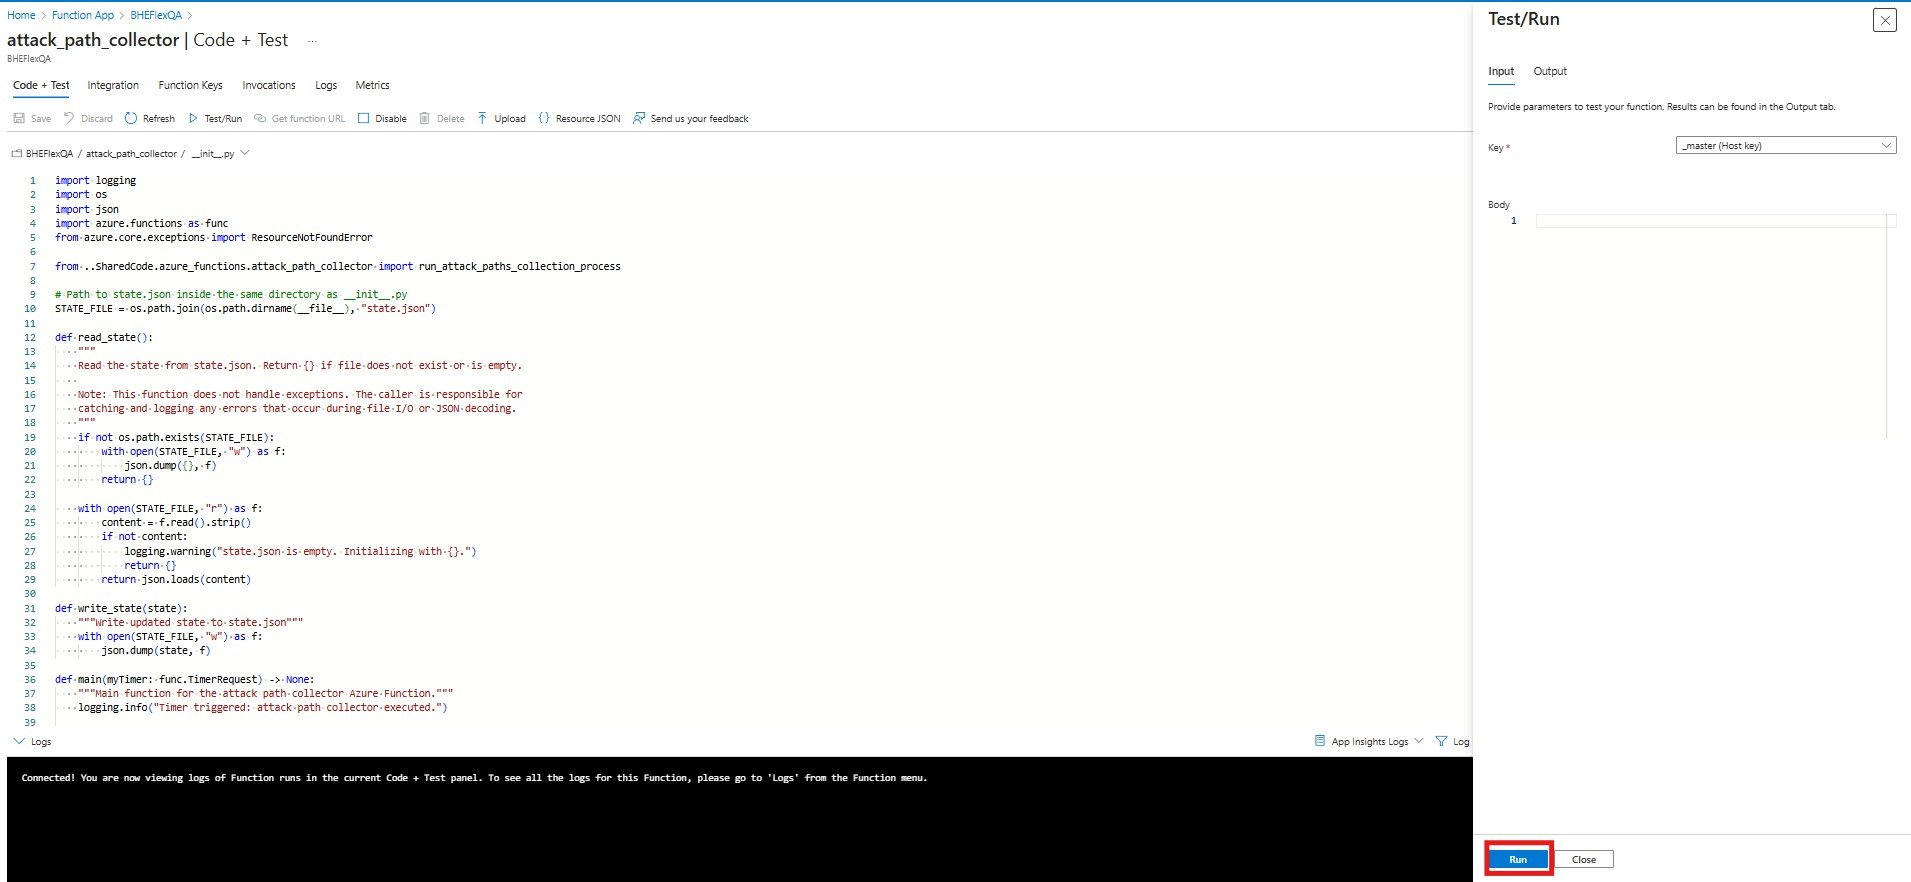
- Click the Code + Test tab.
- Click Test/Run.
-
Click Run to execute the function.
-
Monitor the execution logs to confirm that the function is running successfully and fetching data from BloodHound Enterprise.
You should see log entries indicating successful execution and data retrieval for each finding type.
Show example
- Repeat this one-time manual process for each deployed function to ensure all functions are working correctly.
Validate the integration
Complete verification before operational use.1
Verify connector resources
-
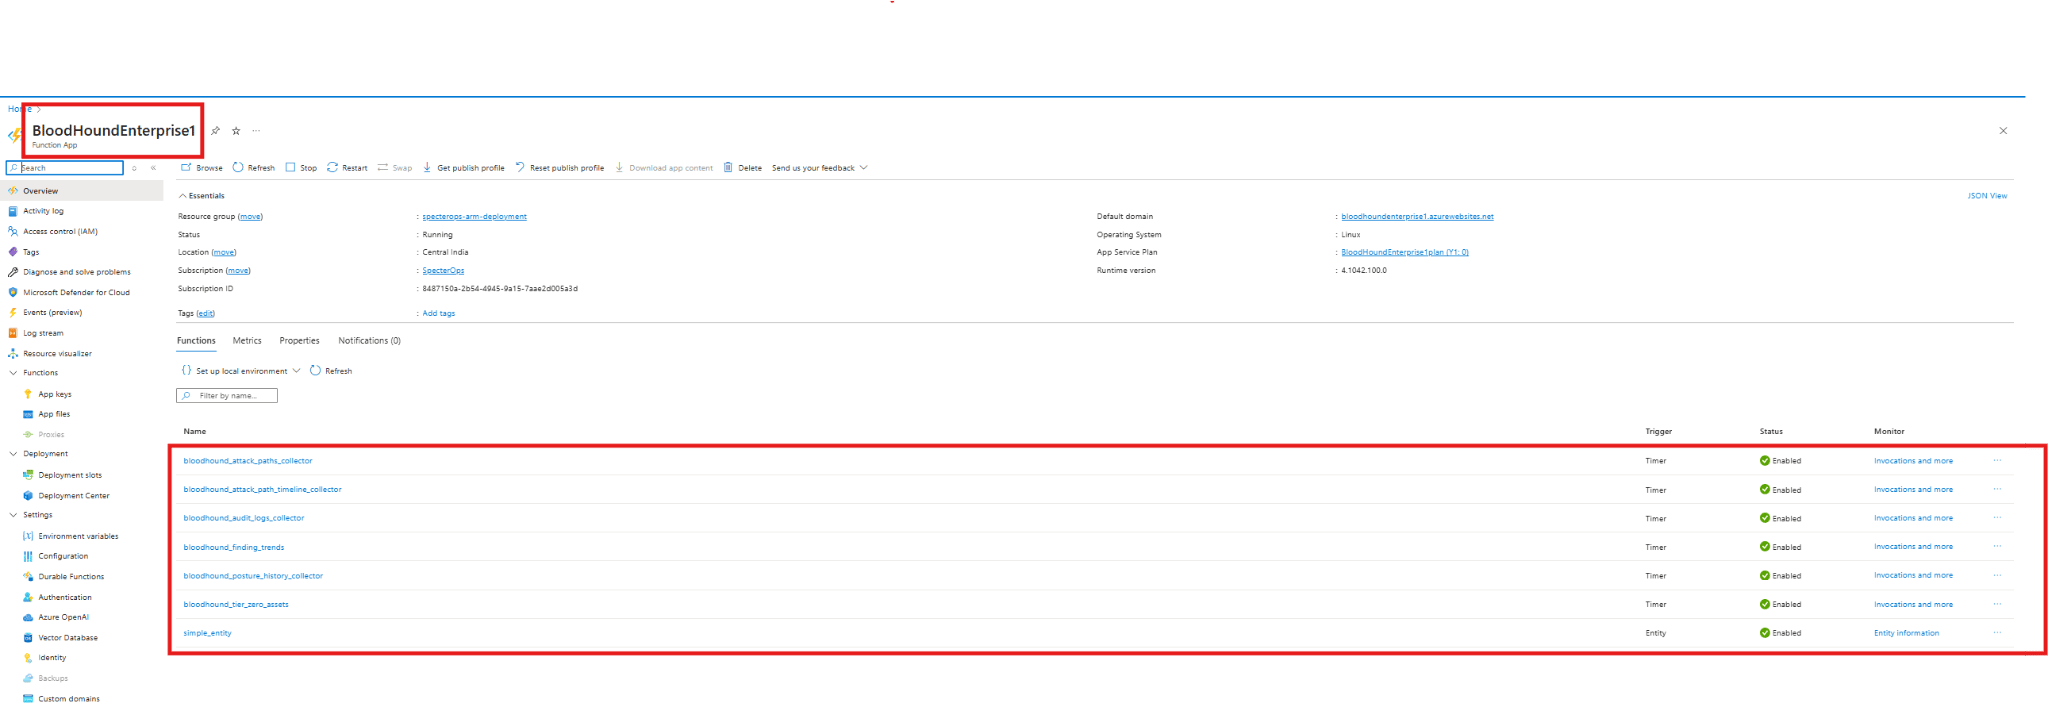
In Azure Portal, open Function App and confirm your deployed app exists and all BloodHound functions are listed.
-
Open Key Vault and confirm the connector vault exists and includes the expected secrets.

-
Open Data Collection Endpoints and confirm the BloodHound endpoint exists.

-
Open Data Collection Rules and confirm the BloodHound rules exist.

-
Open your Log Analytics workspace and confirm these custom tables exist:
BHEAttackPathsData_CLBHEAttackPathsTimelineData_CLBHEAuditLogsData_CLBHEFindingTrendsData_CLBHEPostureHistoryData_CLBHETierZeroAssetsData_CL
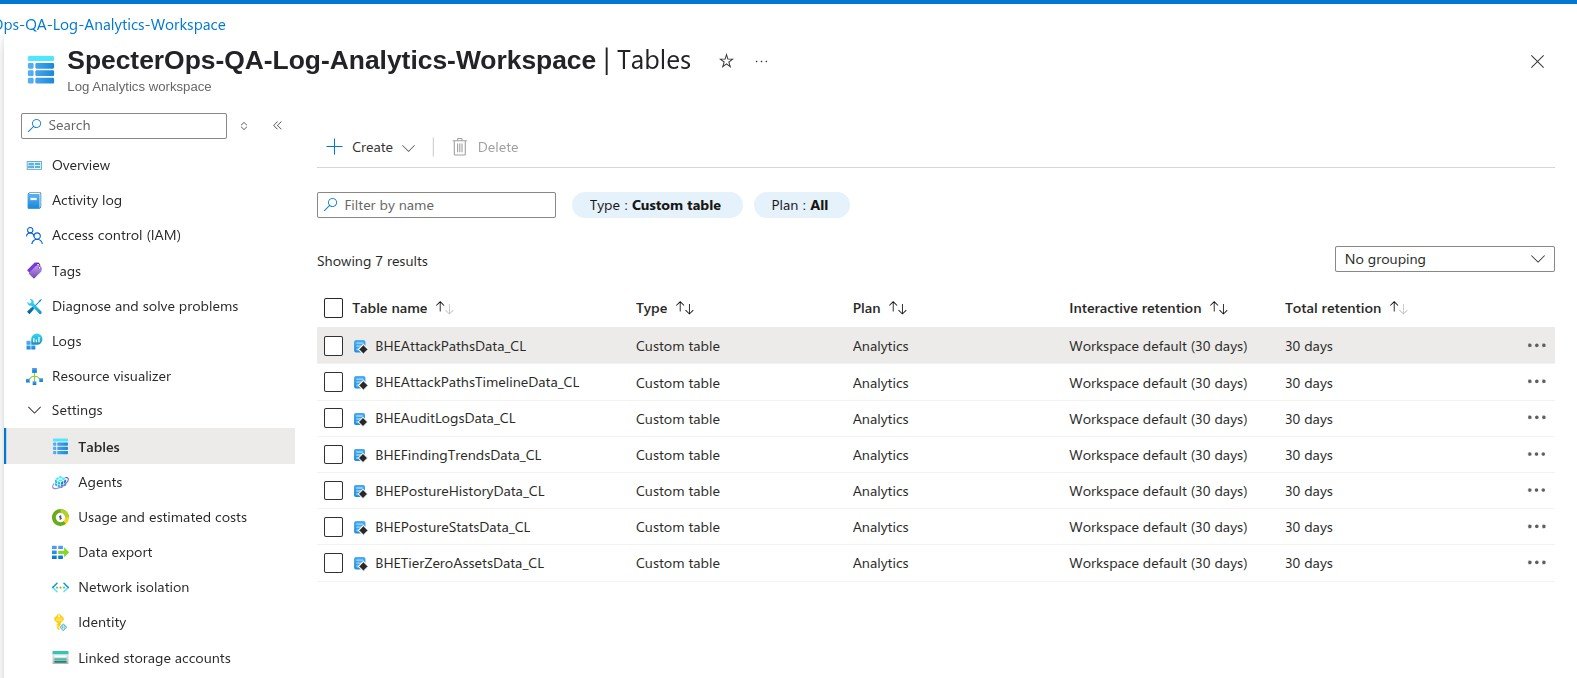
2
Verify data connector ingestion
Complete these steps to start your Azure Function App and begin ingesting BloodHound Enterprise data into custom tables.
- Open your Function App and start it from Overview if it is stopped.
- Open your Log Analytics workspace and click Logs.
-
Verify that you can see custom logs.
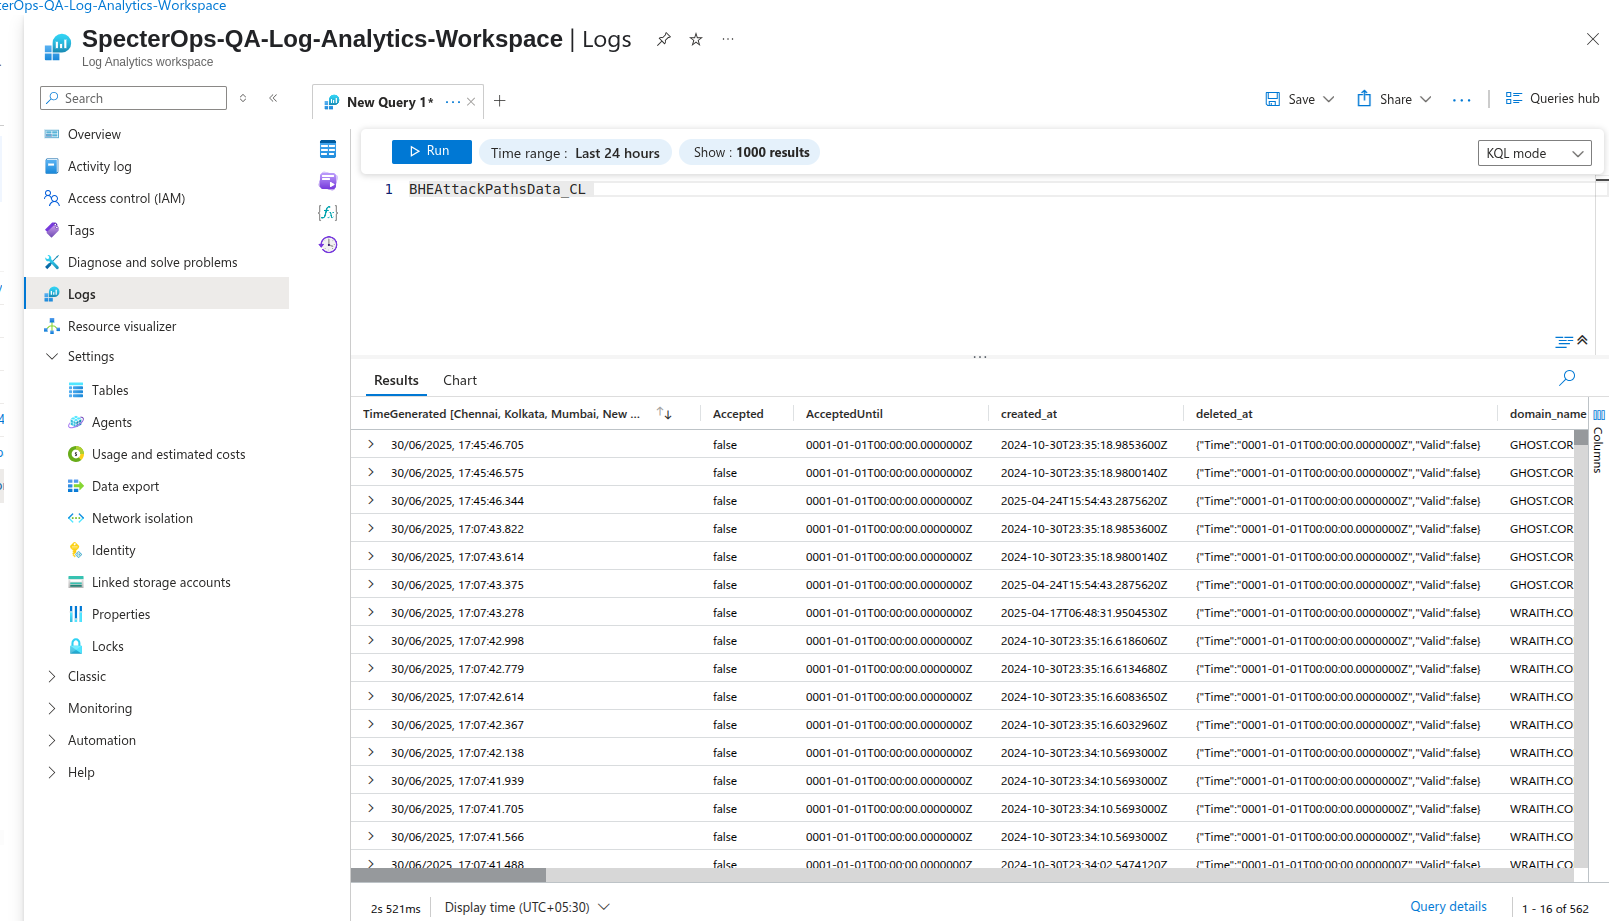
3
Activate dashboards and analytics rules
-
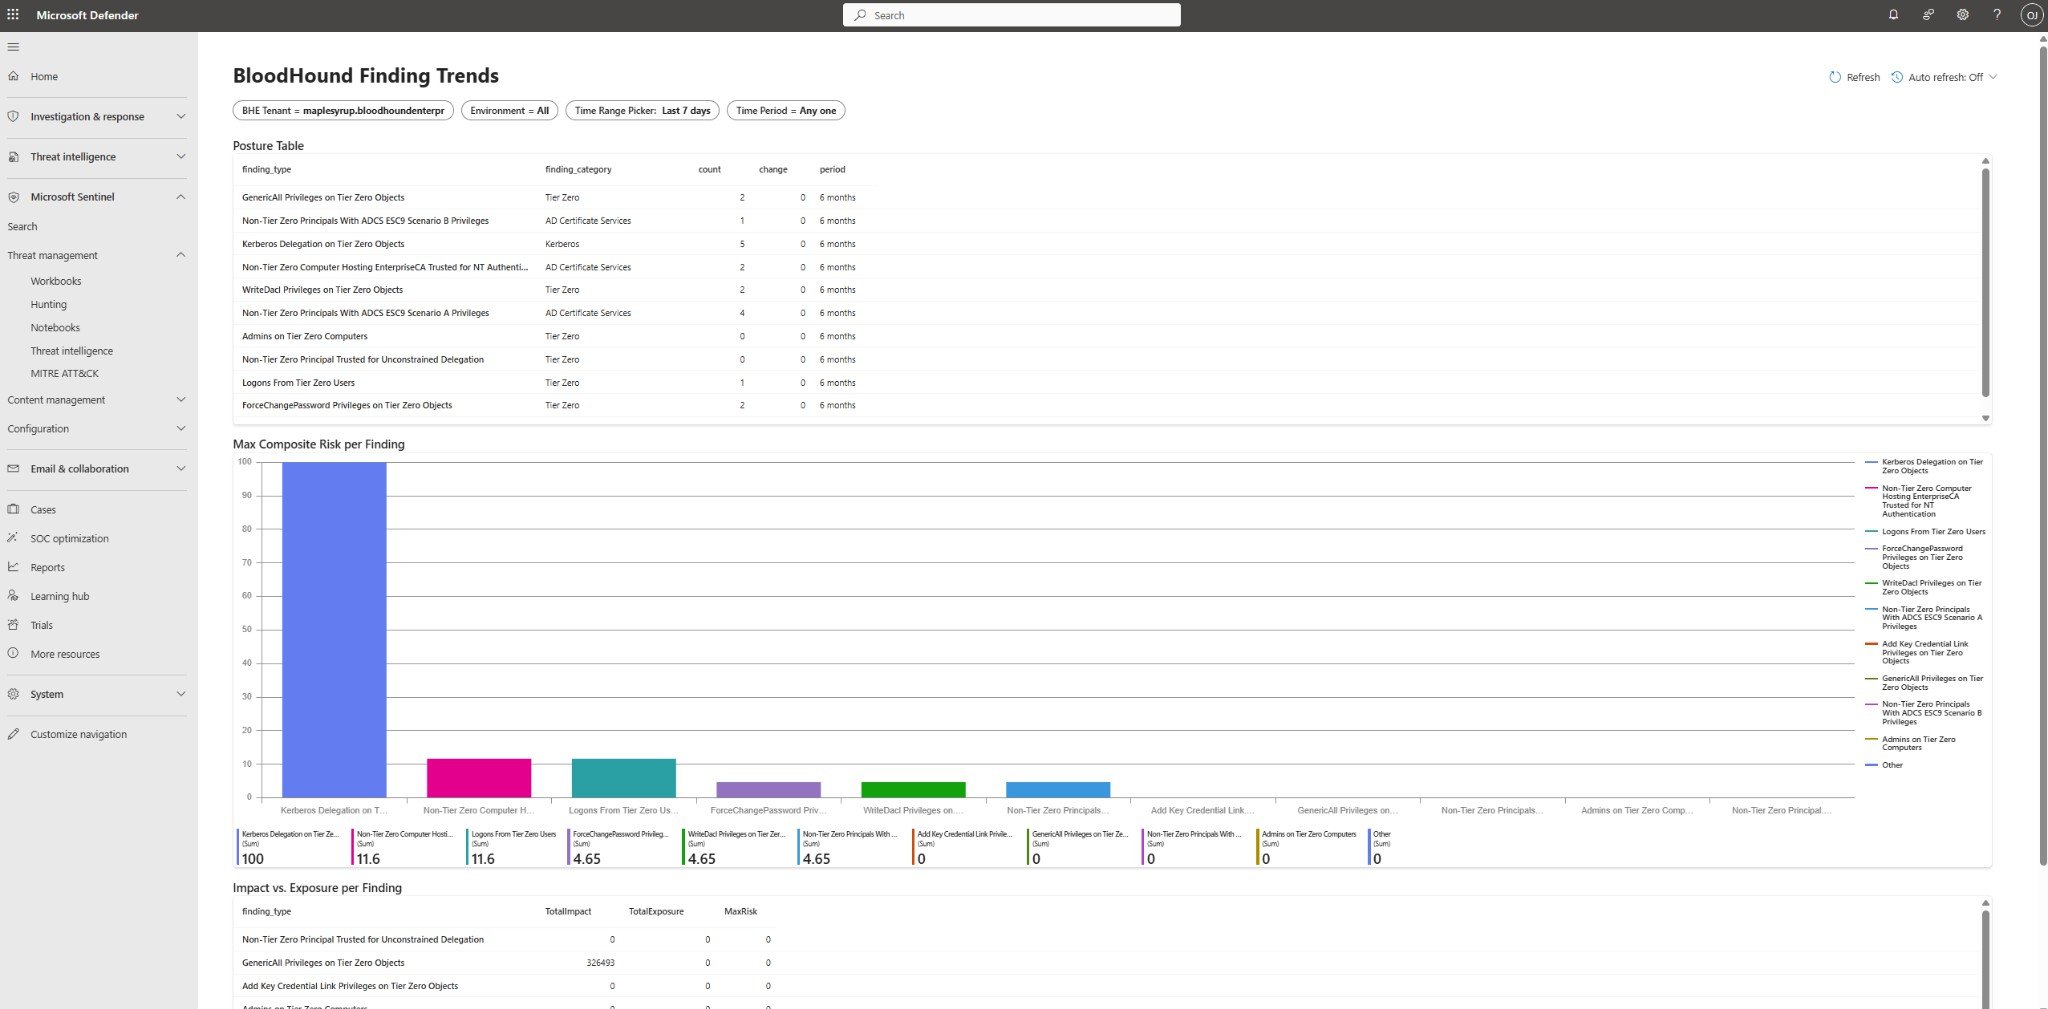
In Microsoft Sentinel, go to Workbooks. You must save each workbook before editing or operational use.
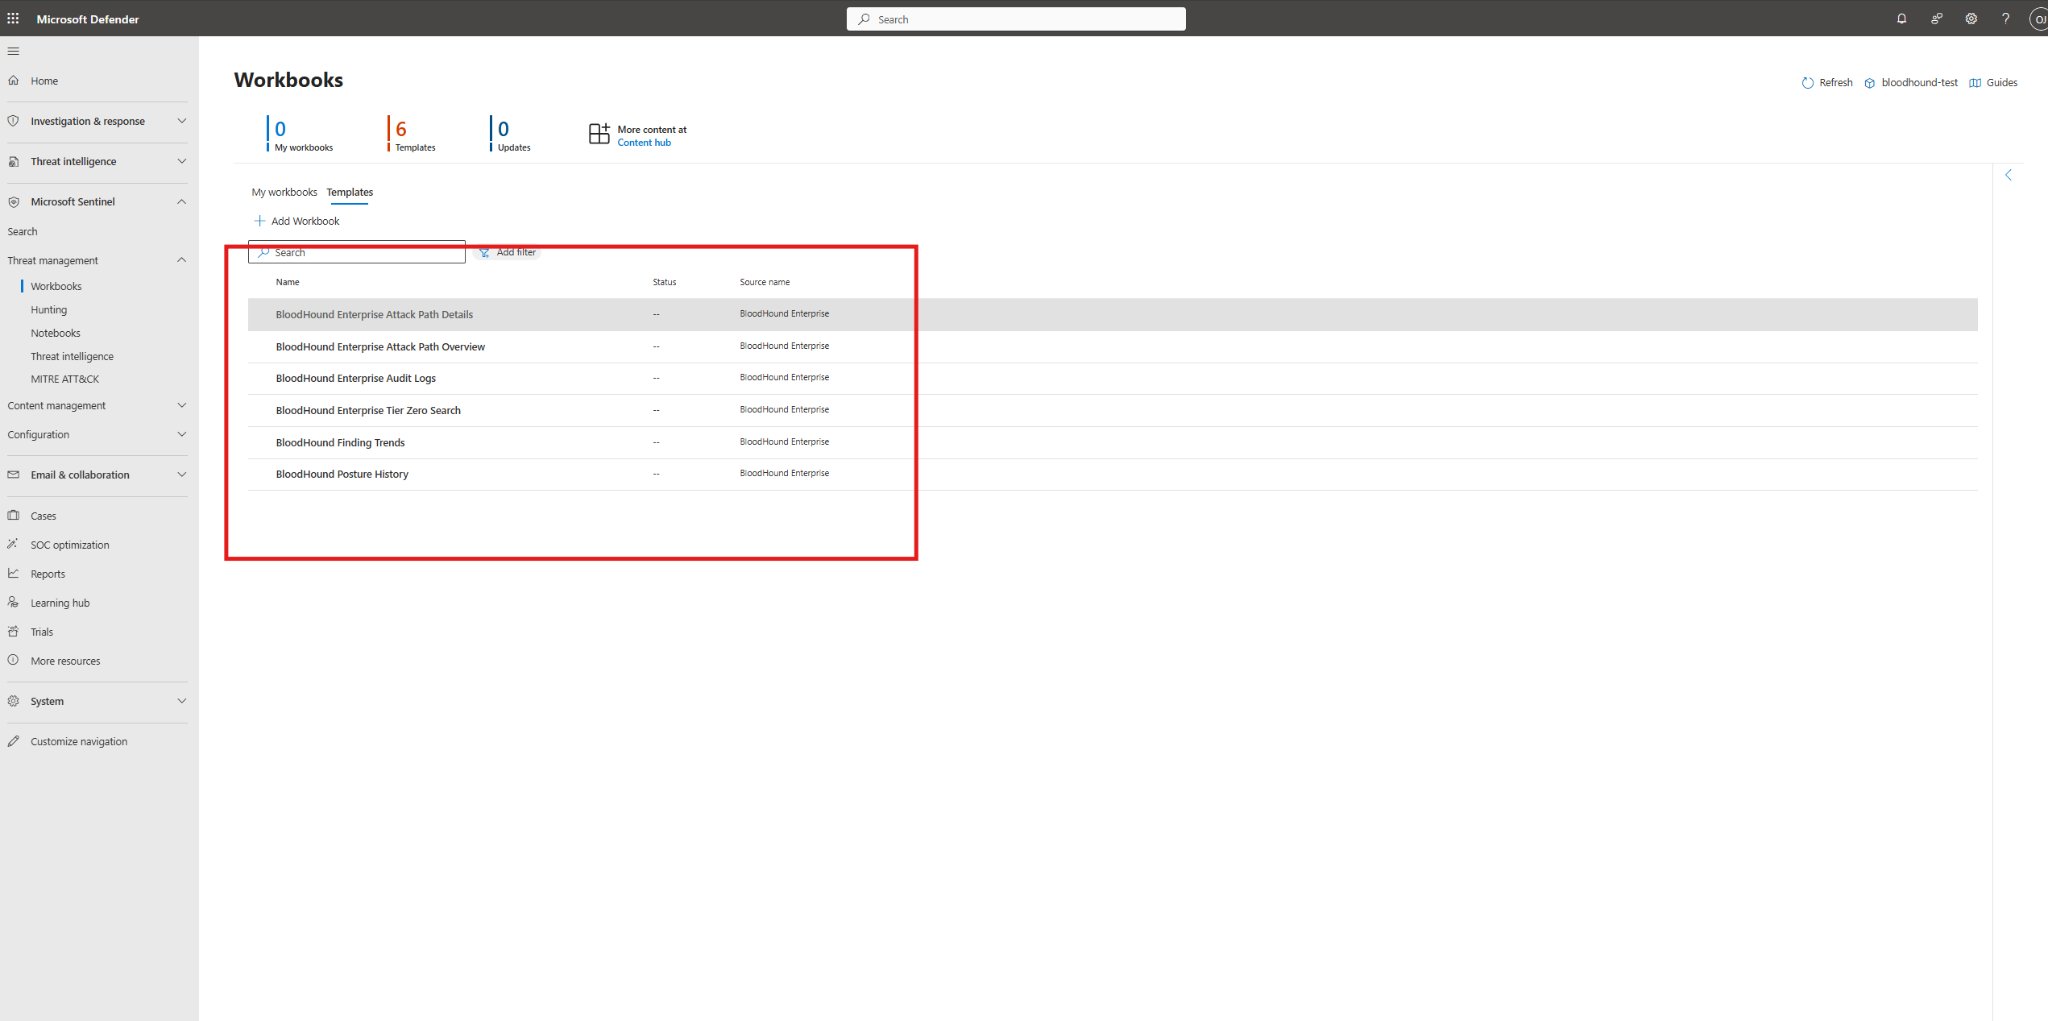
-
To save each workbook, double-click the workbook, then click Save in the modal that displays.
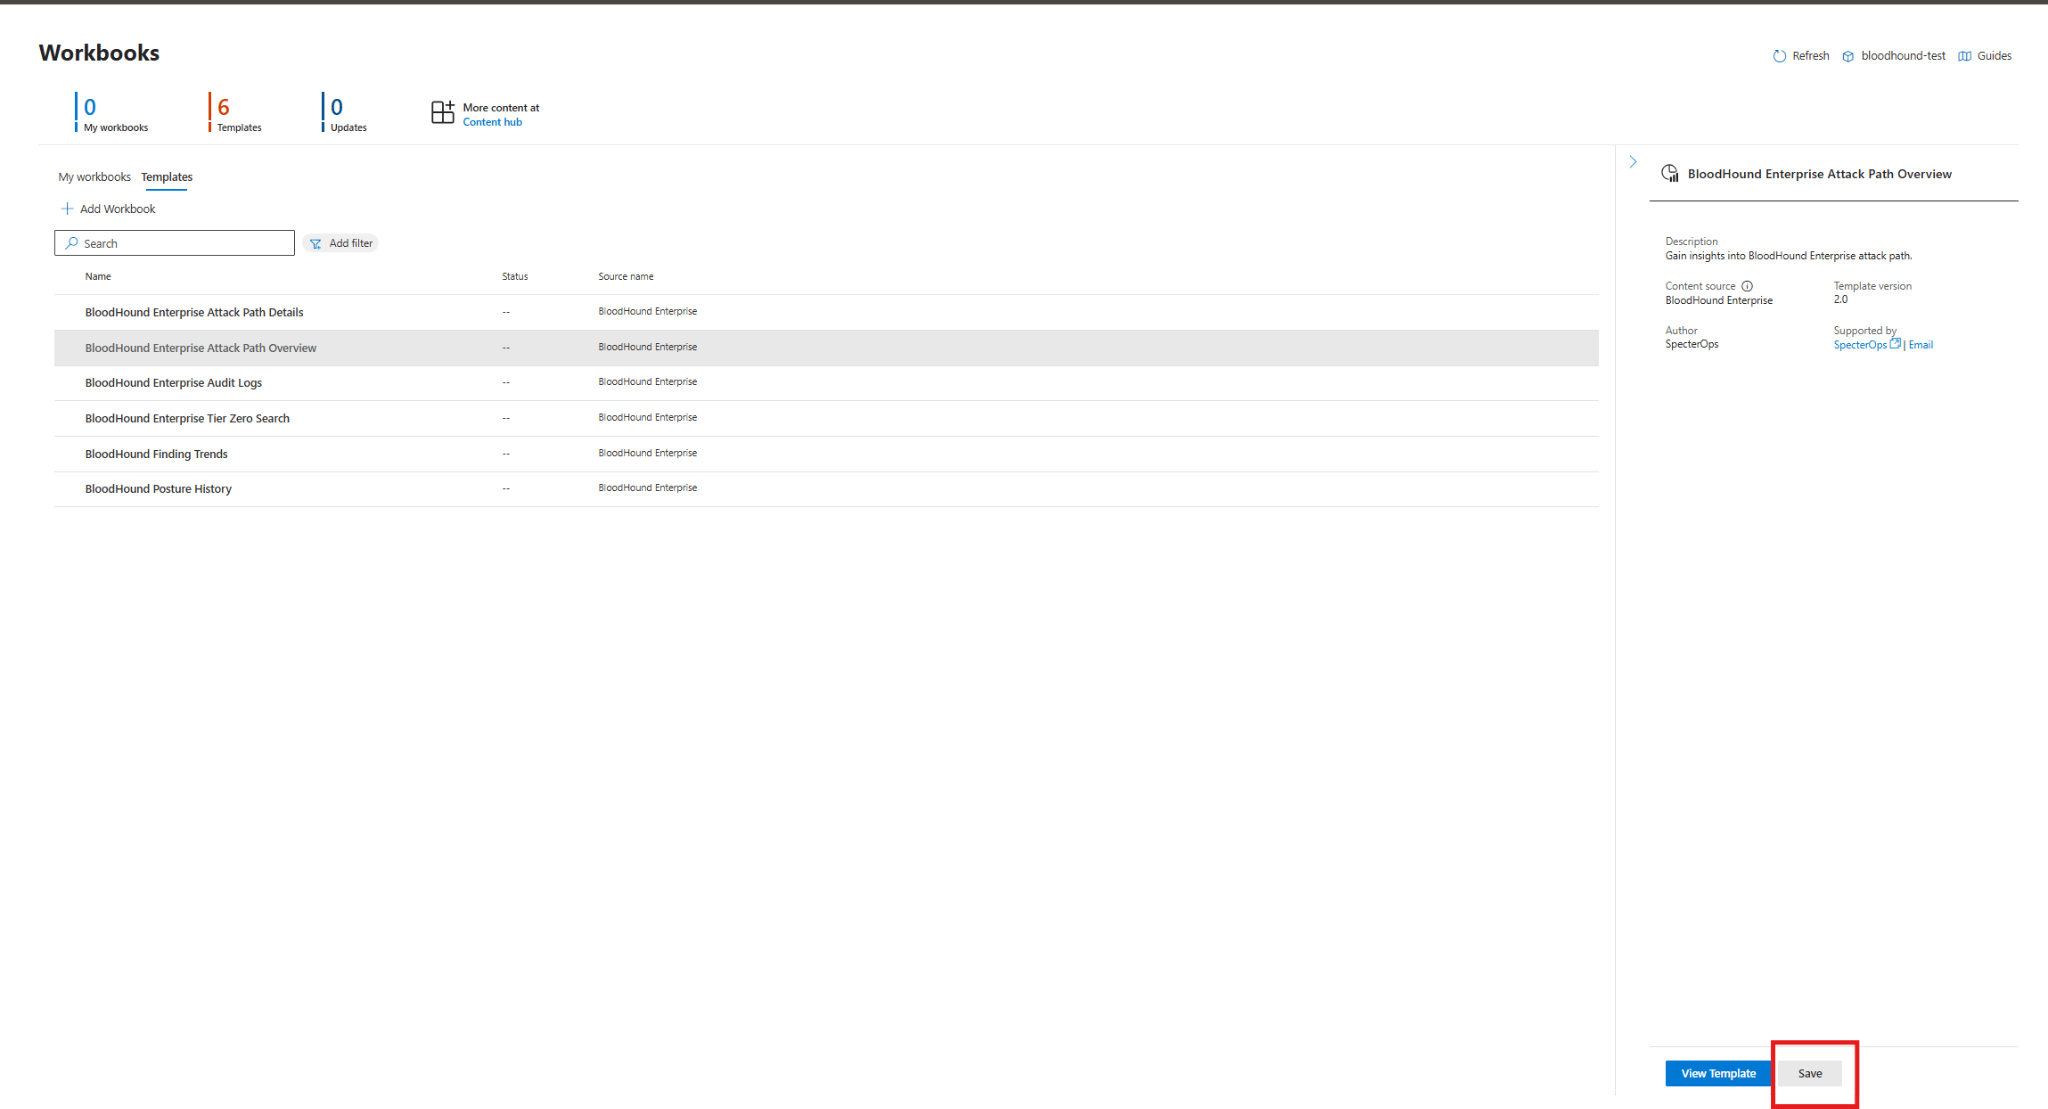
-
Open each workbook to confirm it loads data correctly. If you see errors, review the function execution logs and ensure the data connector is ingesting data into the custom tables.
4
Verify analytics rules
-
In the Sentinel workspace, navigate to Configuration > Analytics > Rule templates.
-
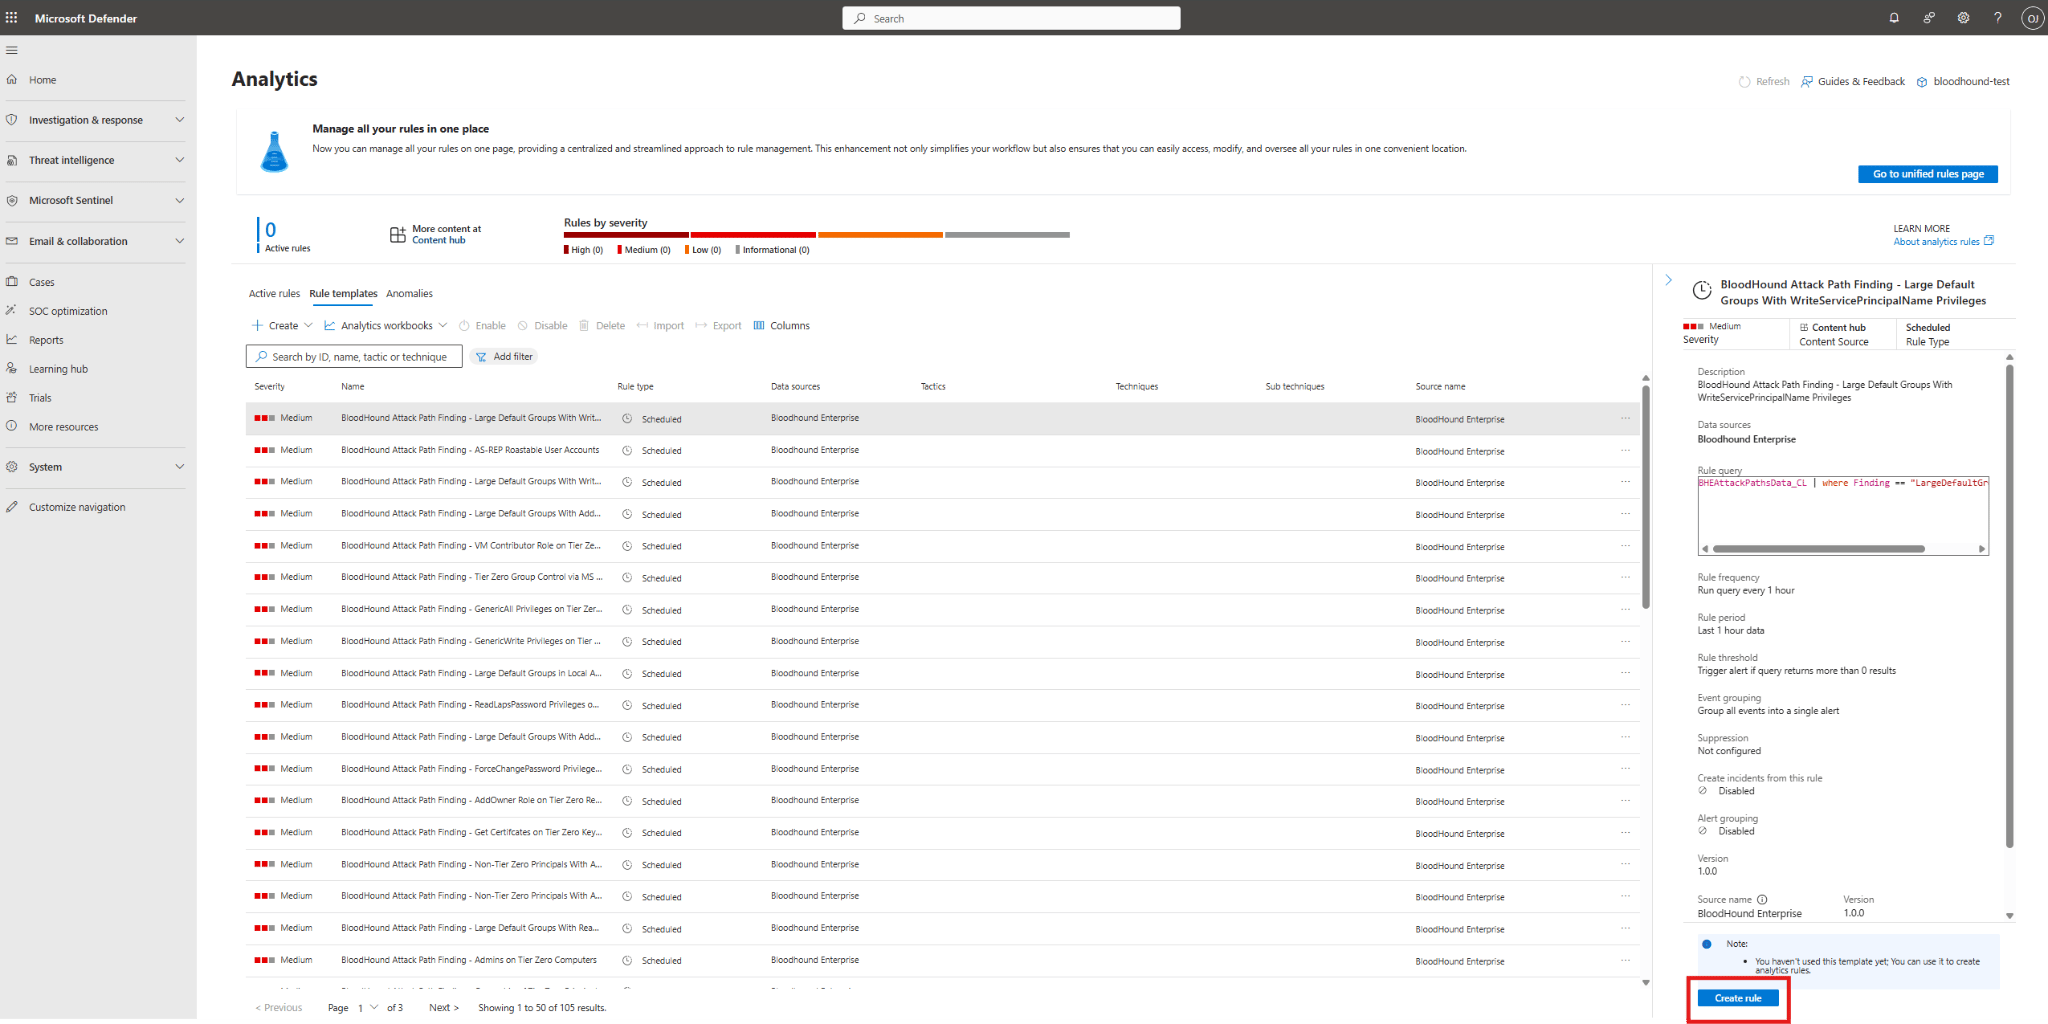
To generate incidents, create and save each Analytics rule. Select any rule to open the right-side panel, then click Create rule.
-
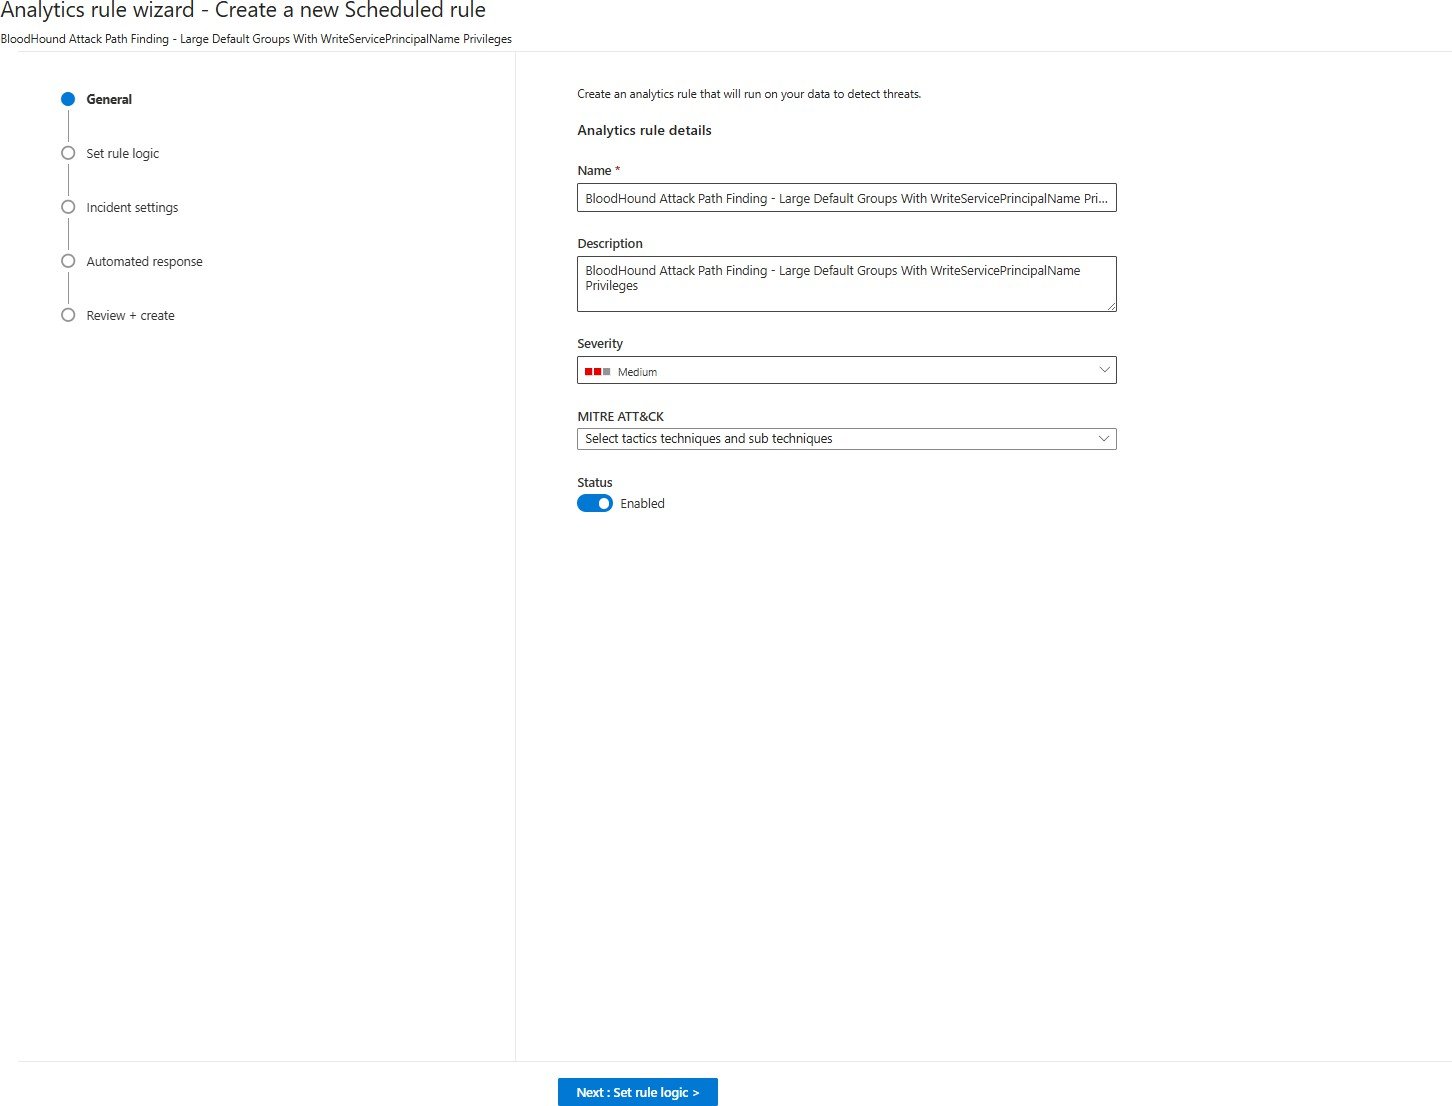
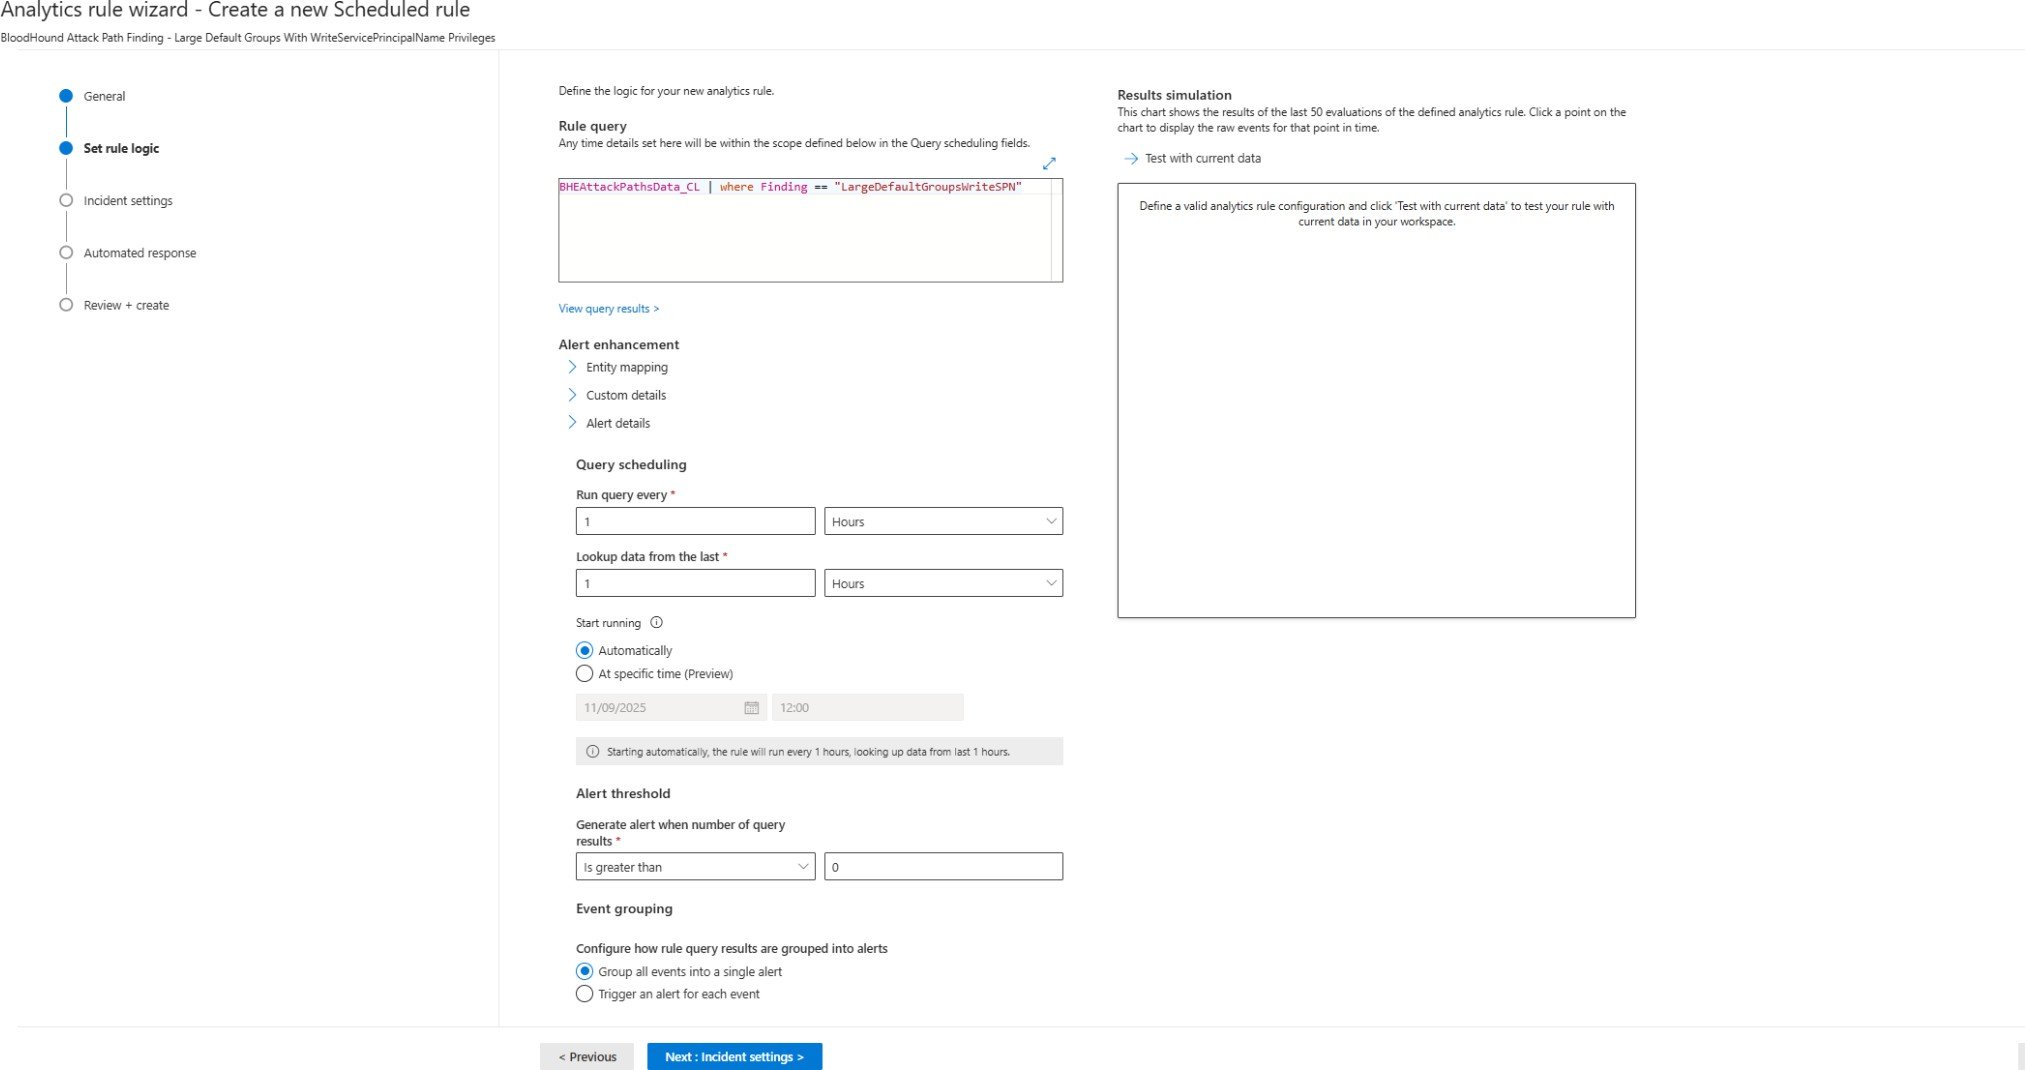
Click Next: Set rule logic and keep the default values.
-
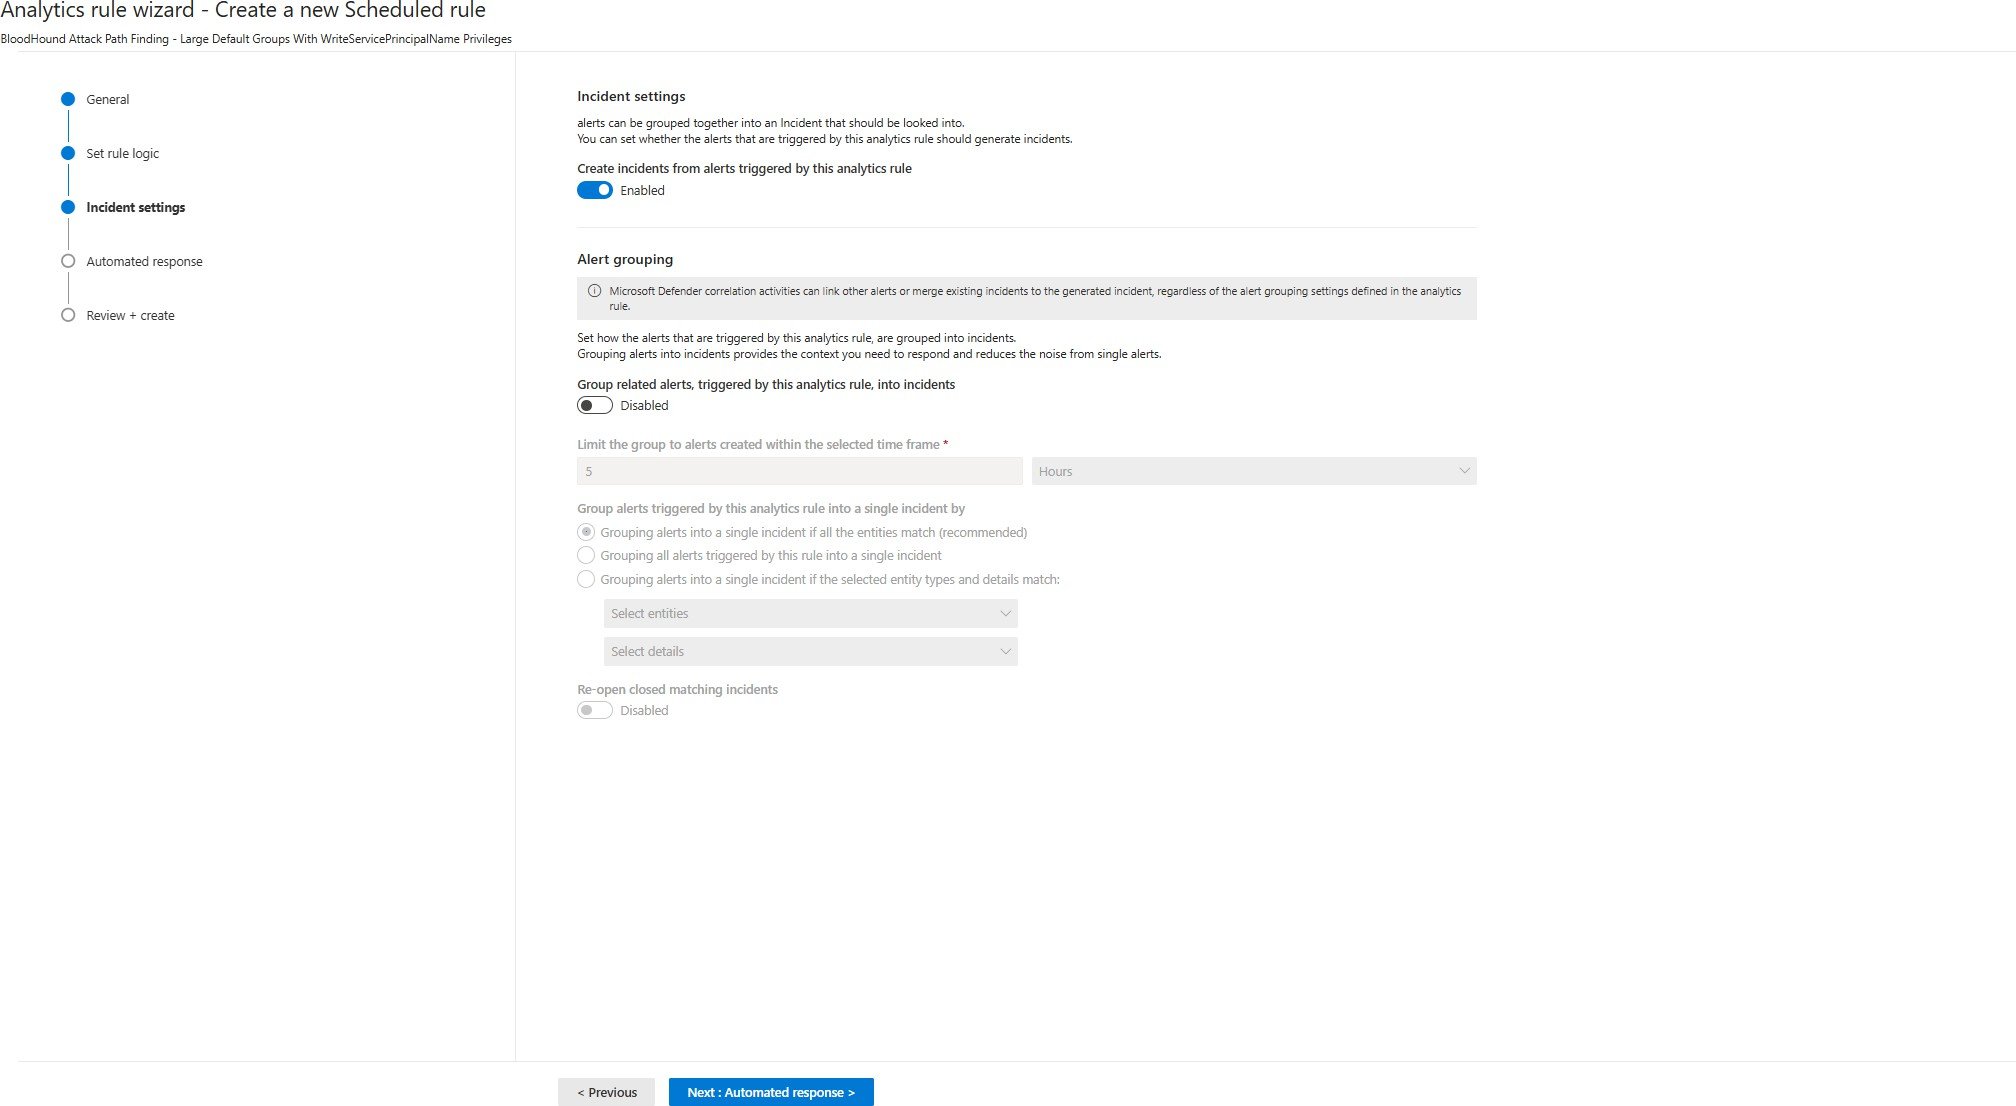
Click Next: Incident settings and keep the default values.
-
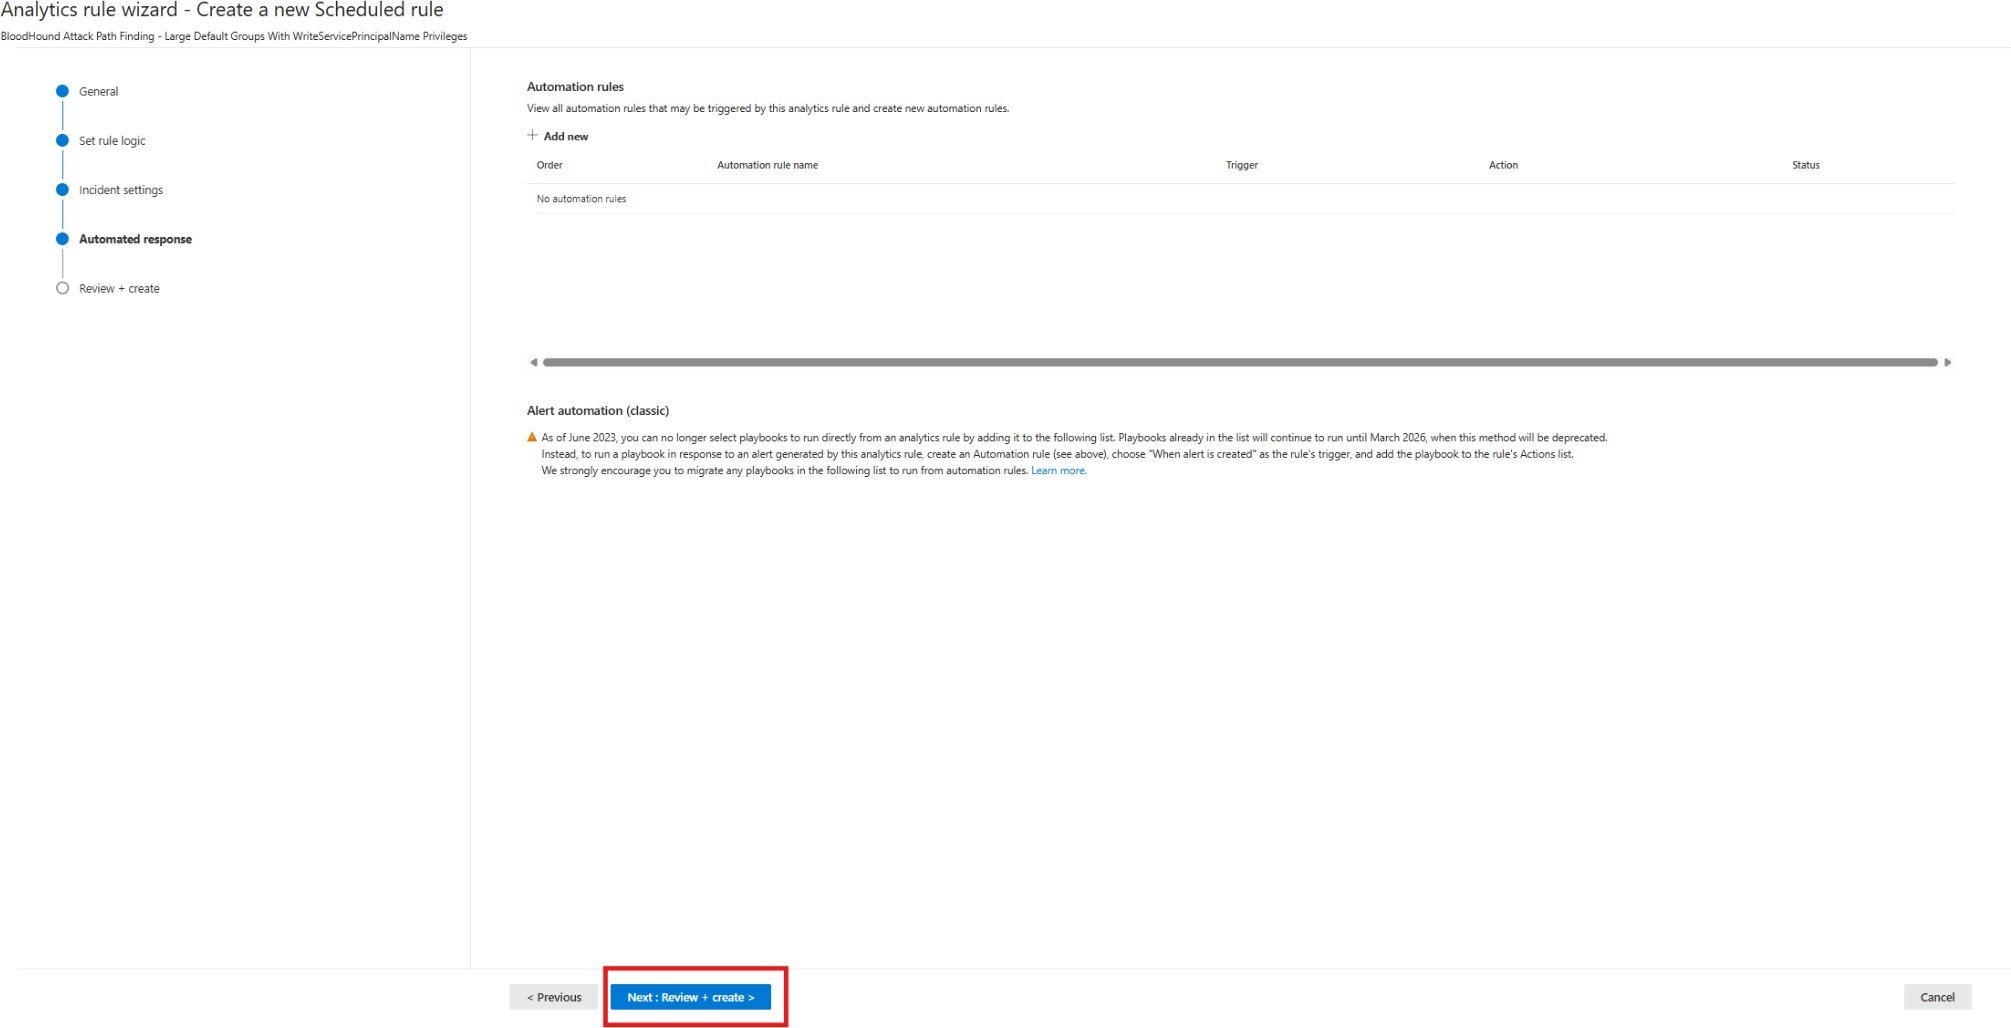
Click Next: Automated response and keep the default values.
-
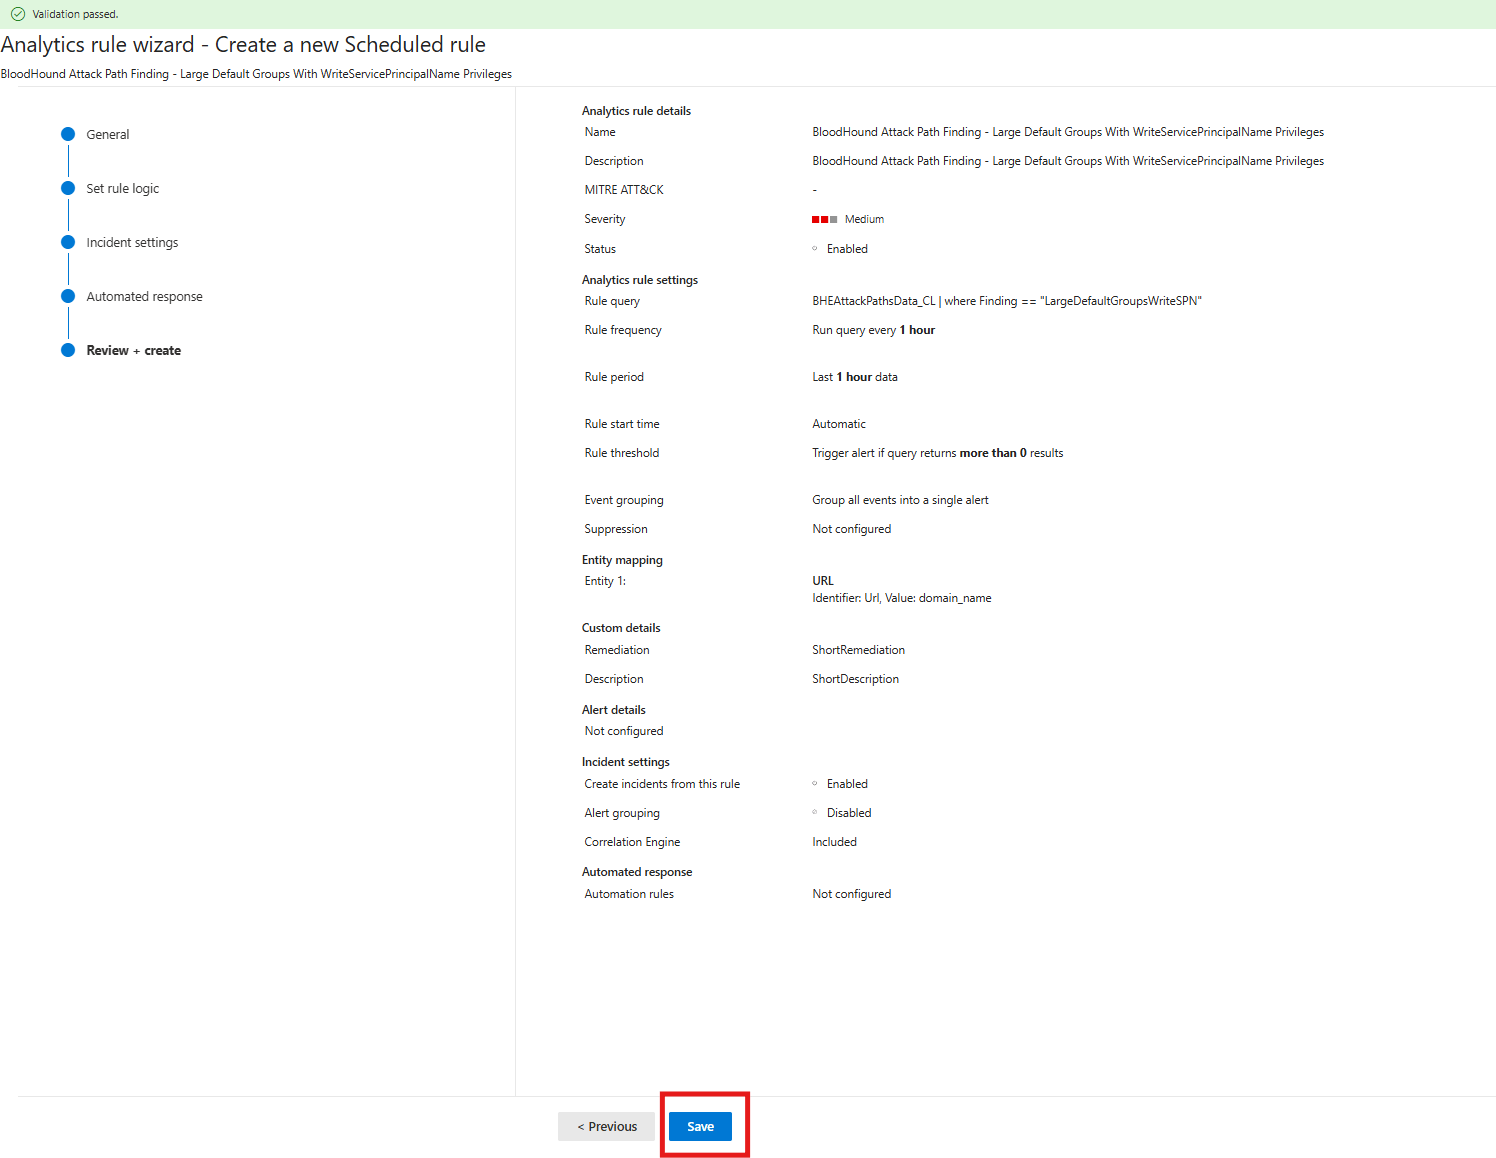
Click Next: Review + Create and keep the default values.
-
Click Save.
- Repeat this process for each Analytics rule. Incidents are generated only after the rules are created and saved.
-
To check incidents after rules are created, navigate to Investigation & Responses > Incidents & Alerts > Incidents.