> ## Documentation Index
> Fetch the complete documentation index at: https://bloodhound.specterops.io/llms.txt
> Use this file to discover all available pages before exploring further.
# Use the BloodHound Enterprise Splunk app
> Learn how to use the BloodHound Enterprise Splunk app to visualize and analyze BloodHound Enterprise data within Splunk.
 The BloodHound Enterprise Splunk app provides several dashboards that allow you to gain insights into your environments. These dashboards visualize data ingested from various BloodHound Enterprise data inputs, including posture statistics, attack paths, audit logs, and tier zero assets.
You configure the [data inputs](/integrations/splunk/siem/install#configure-the-app-required) for these dashboards during the installation and configuration of the BloodHound Enterprise Splunk app.
Each dashboard offers filtering options to help you analyze data based on different parameters such as BloodHound Enterprise tenant, domain, and time range. Dashboards also provide standard Splunk controls for managing dashboards and visualizations. See the Splunk [documentation](https://docs.splunk.com/Documentation/Splunk/latest/Viz/Dashboards) for more information.
## Dashboard Summary
Use this overview to find the right dashboard quickly. Detailed panels and filters are documented in each subsection below.
| Dashboard | Purpose | Data Input |
| ---------------- | --------------------------------------------------------------------------------------------------------------------------- | ------------------ |
| Posture History | Monitor posture trends (exposure, findings, attack paths, Tier Zero assets) over time for selected tenants and environments | Posture Statistics |
| Attack Paths | Analyze attack paths across domains, including principals involved, exposure levels, severity, and associated findings | Attack Paths |
| Audit Logs | Filter and analyze administrative and system audit events collected by BloodHound Enterprise | Audit Logs |
| Tier Zero Assets | Inventory Tier Zero assets across domains and analyze their distribution and details | Tier Zero Assets |
## Posture History
The **Posture History** dashboard helps you monitor [posture](/analyze-data/findings/posture) trends over time for your BloodHound Enterprise tenants and environments. It provides insights about trends in exposure levels, findings, attack paths, and Tier Zero assets.
All panels in this dashboard use data from the **Posture Statistics** data input and share the following filters:
* BloodHound Tenant
* Environment
* Time Range
The following sections describe each panel on this dashboard.
### Exposure
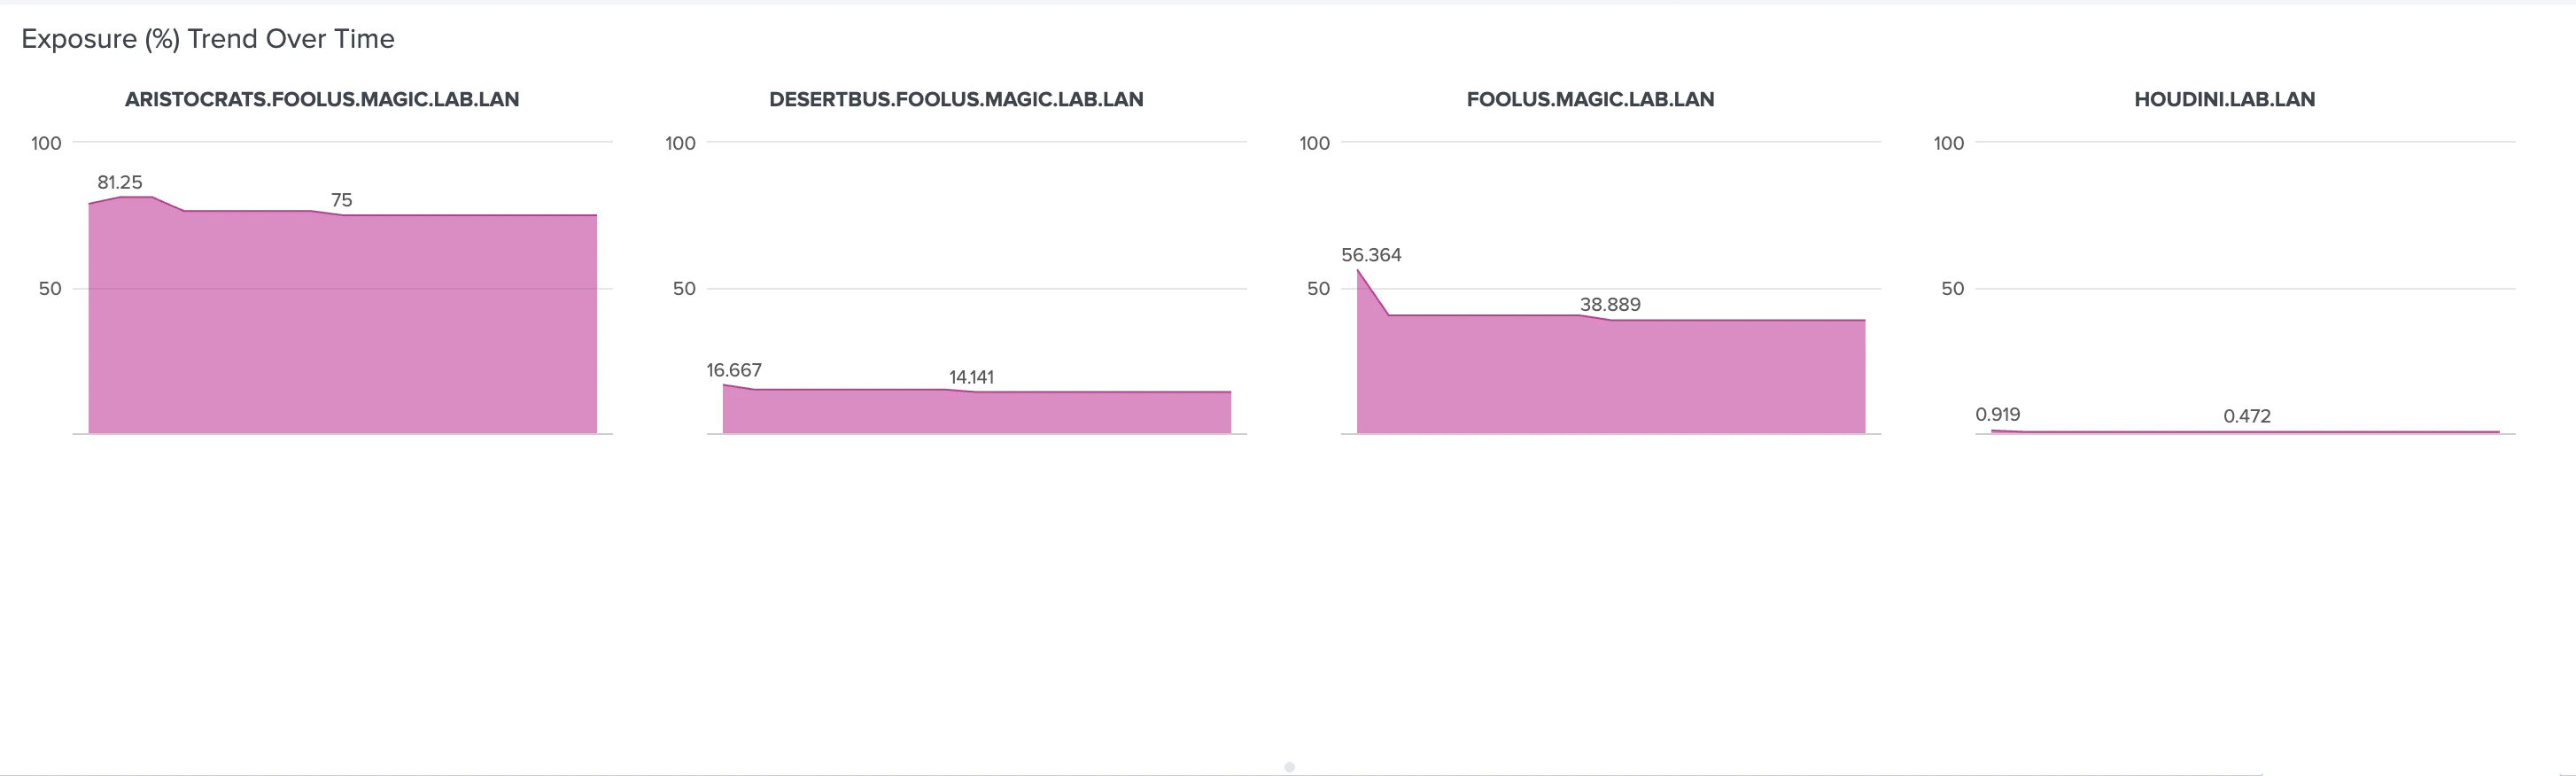
This panel shows the trend (by percentage) of exposure over time for the selected BloodHound tenant(s) and environment(s) within a specified time range.
The BloodHound Enterprise Splunk app provides several dashboards that allow you to gain insights into your environments. These dashboards visualize data ingested from various BloodHound Enterprise data inputs, including posture statistics, attack paths, audit logs, and tier zero assets.
You configure the [data inputs](/integrations/splunk/siem/install#configure-the-app-required) for these dashboards during the installation and configuration of the BloodHound Enterprise Splunk app.
Each dashboard offers filtering options to help you analyze data based on different parameters such as BloodHound Enterprise tenant, domain, and time range. Dashboards also provide standard Splunk controls for managing dashboards and visualizations. See the Splunk [documentation](https://docs.splunk.com/Documentation/Splunk/latest/Viz/Dashboards) for more information.
## Dashboard Summary
Use this overview to find the right dashboard quickly. Detailed panels and filters are documented in each subsection below.
| Dashboard | Purpose | Data Input |
| ---------------- | --------------------------------------------------------------------------------------------------------------------------- | ------------------ |
| Posture History | Monitor posture trends (exposure, findings, attack paths, Tier Zero assets) over time for selected tenants and environments | Posture Statistics |
| Attack Paths | Analyze attack paths across domains, including principals involved, exposure levels, severity, and associated findings | Attack Paths |
| Audit Logs | Filter and analyze administrative and system audit events collected by BloodHound Enterprise | Audit Logs |
| Tier Zero Assets | Inventory Tier Zero assets across domains and analyze their distribution and details | Tier Zero Assets |
## Posture History
The **Posture History** dashboard helps you monitor [posture](/analyze-data/findings/posture) trends over time for your BloodHound Enterprise tenants and environments. It provides insights about trends in exposure levels, findings, attack paths, and Tier Zero assets.
All panels in this dashboard use data from the **Posture Statistics** data input and share the following filters:
* BloodHound Tenant
* Environment
* Time Range
The following sections describe each panel on this dashboard.
### Exposure
This panel shows the trend (by percentage) of exposure over time for the selected BloodHound tenant(s) and environment(s) within a specified time range.
 ### Findings
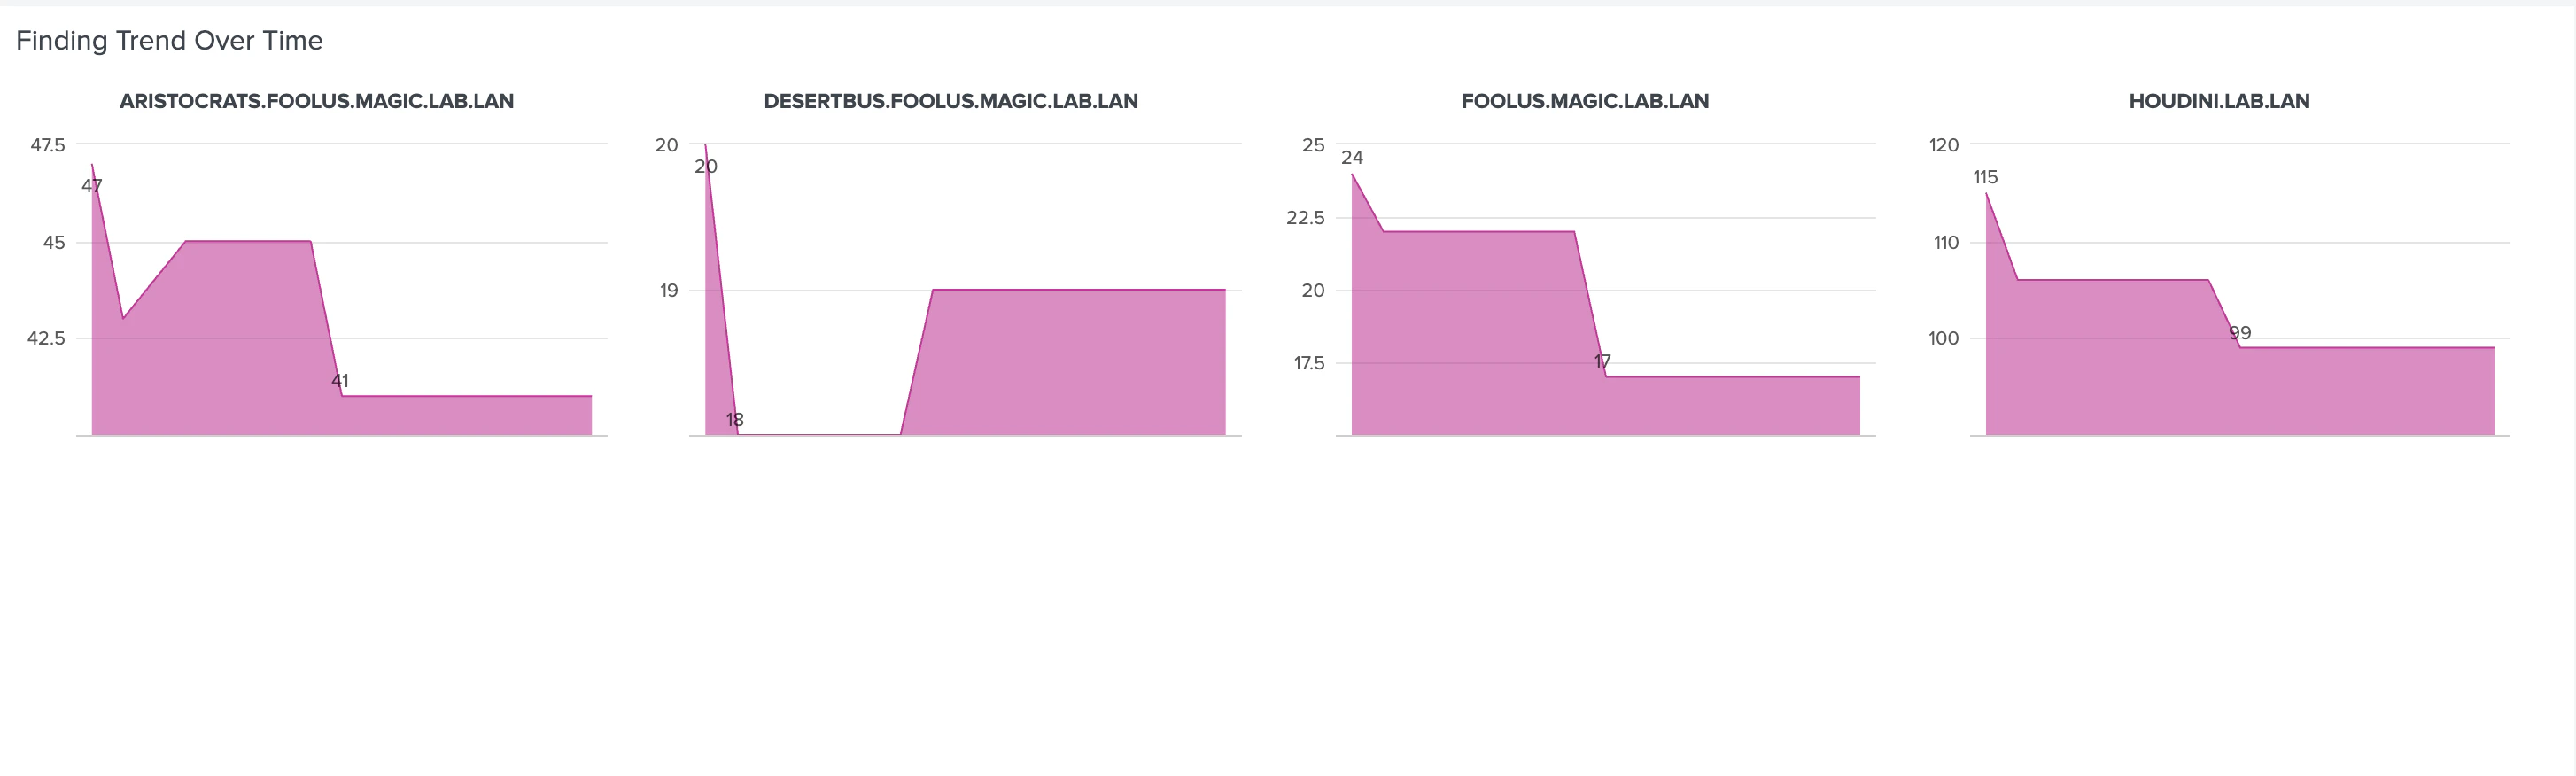
This panel shows the trend (by count) of posture findings over time for the selected BloodHound tenant(s) and environment(s) within a specified time range.
### Findings
This panel shows the trend (by count) of posture findings over time for the selected BloodHound tenant(s) and environment(s) within a specified time range.
 ### Attack Path
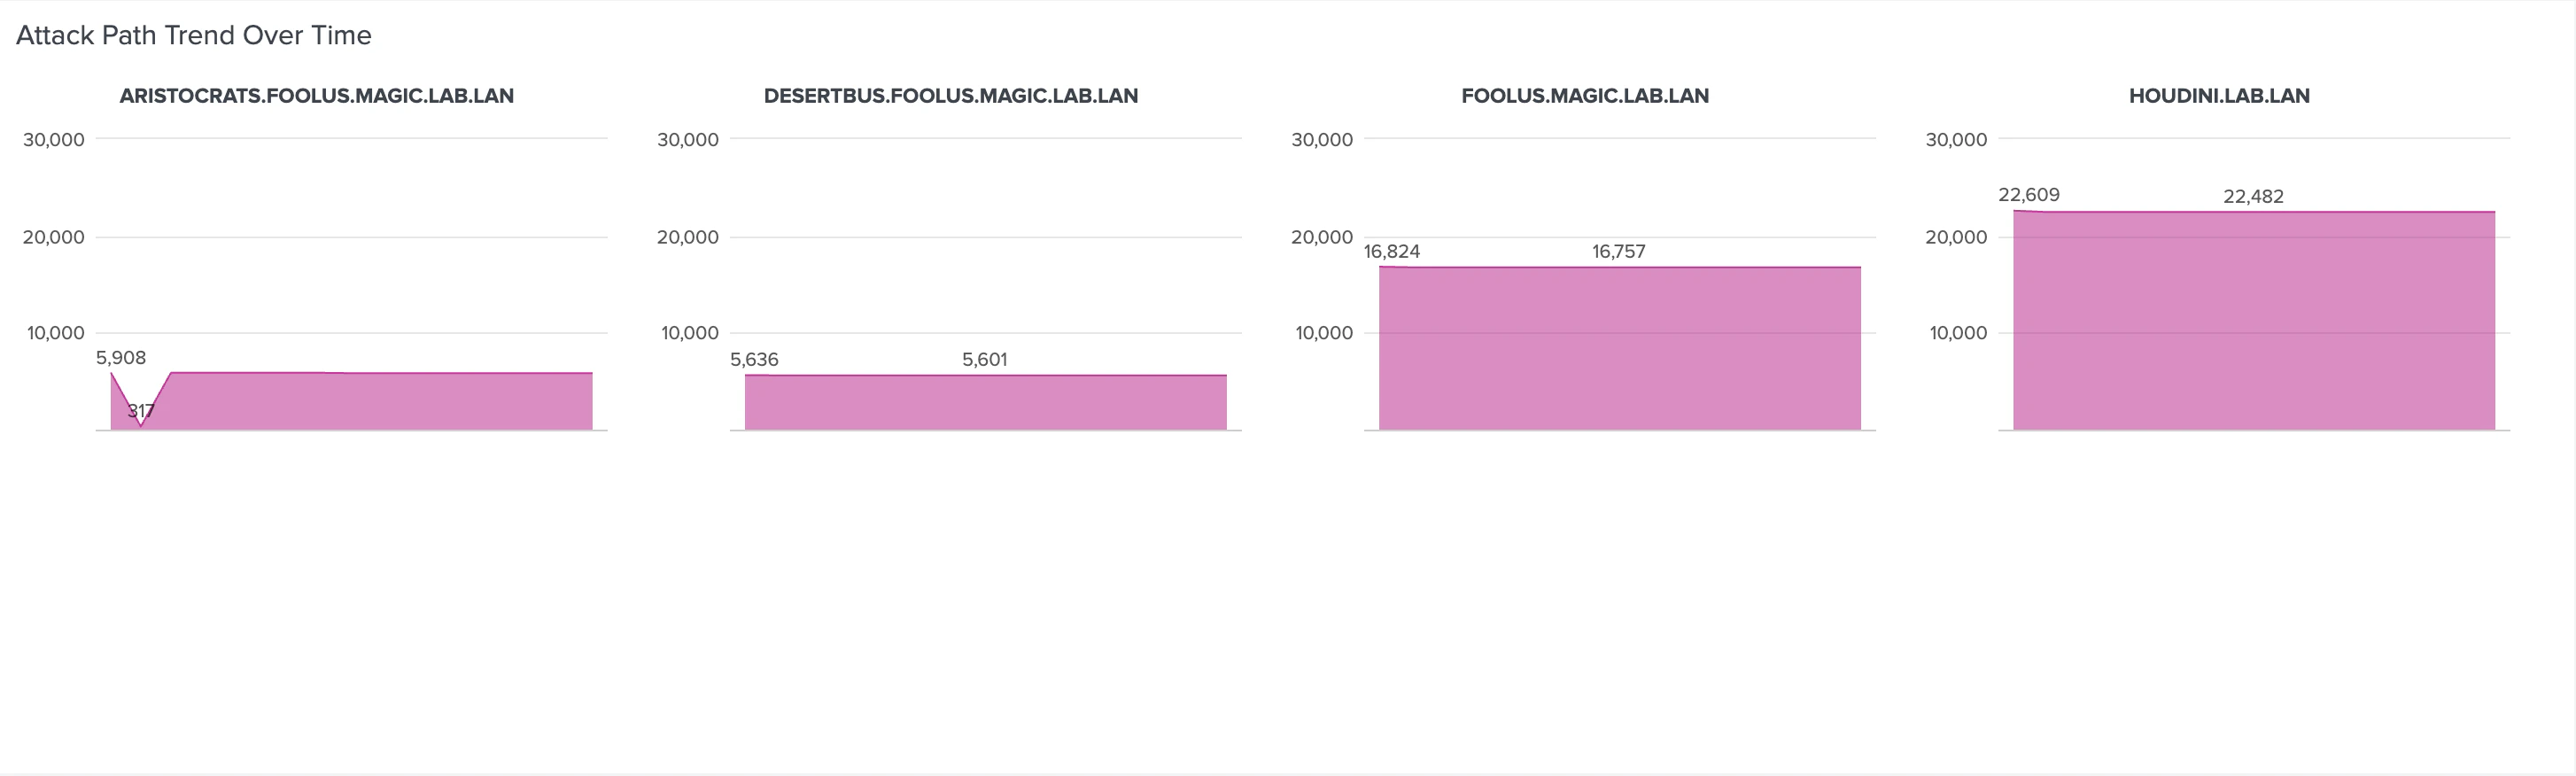
This panel shows the trend (by count) of critical attack paths over time for the selected BloodHound tenant(s) and environment(s) within a specified time range.
### Attack Path
This panel shows the trend (by count) of critical attack paths over time for the selected BloodHound tenant(s) and environment(s) within a specified time range.
 ### Assets
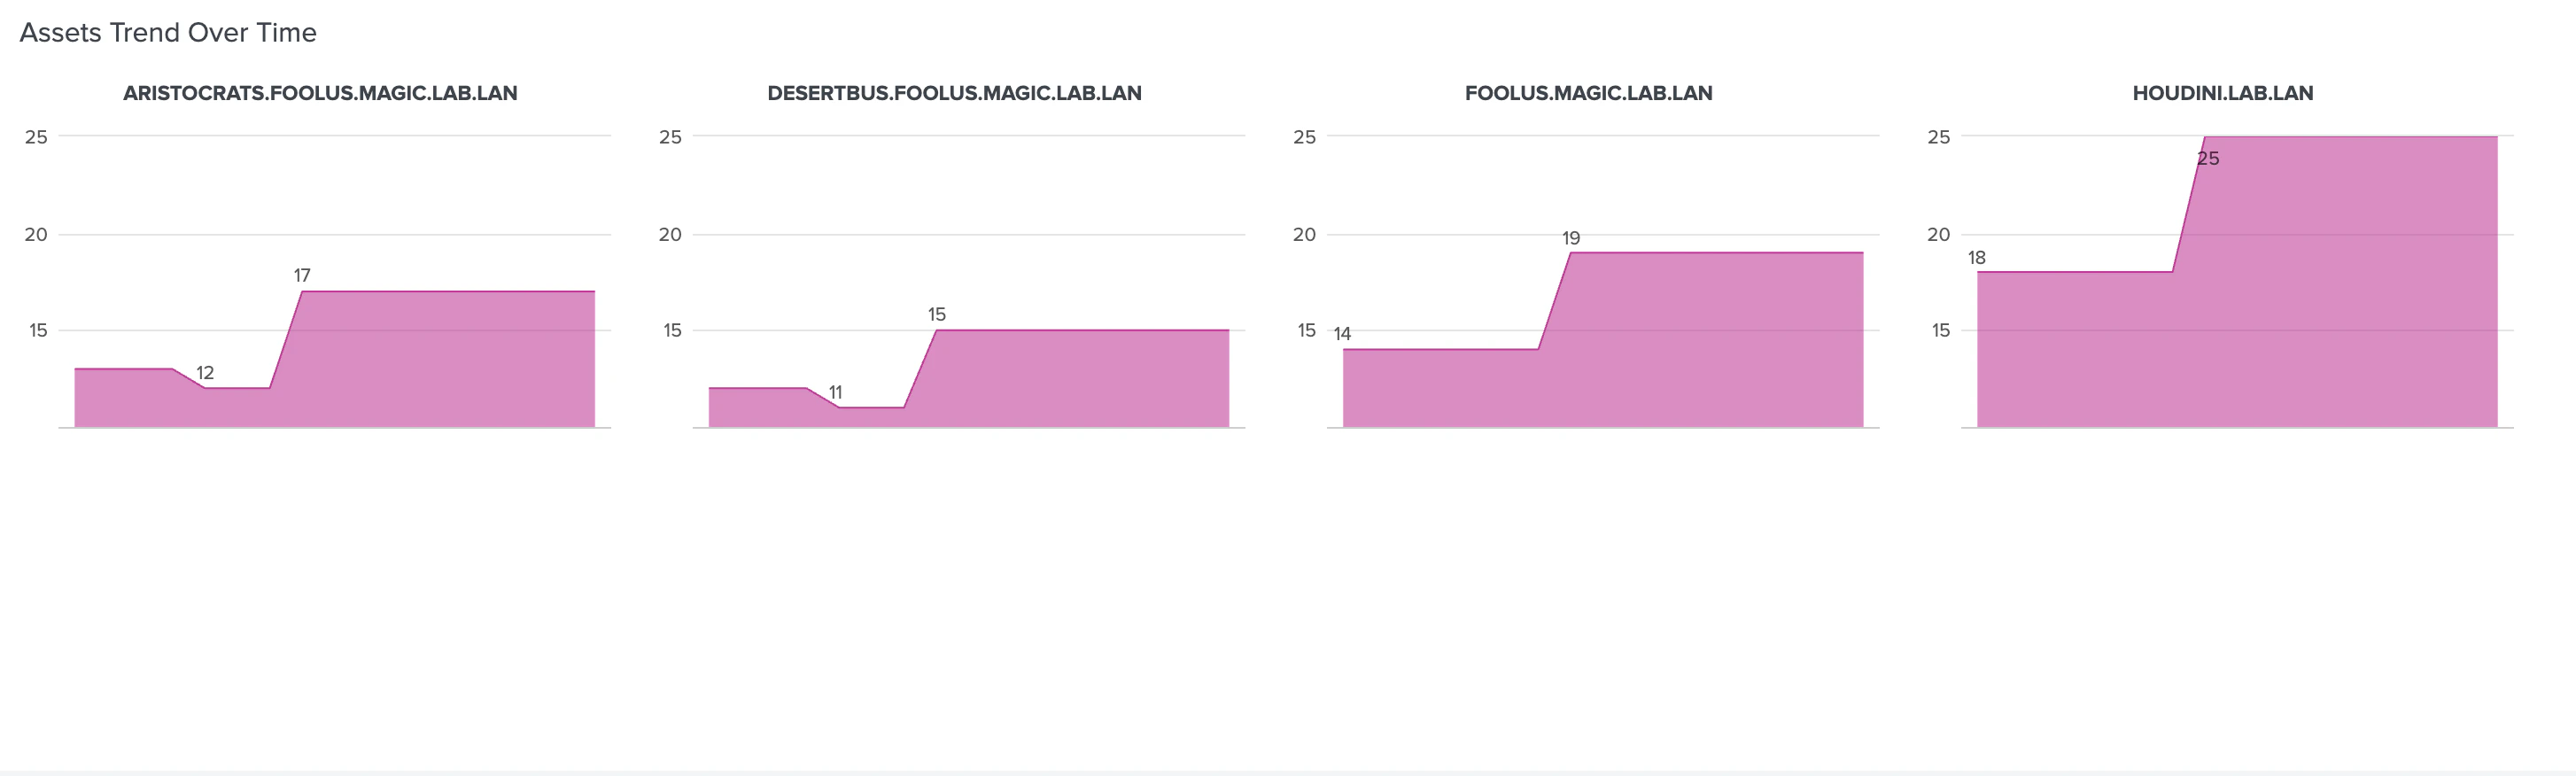
This panel shows the trend (by count) of Tier Zero assets over time for the selected BloodHound tenant(s) and environment(s) within a specified time range.
### Assets
This panel shows the trend (by count) of Tier Zero assets over time for the selected BloodHound tenant(s) and environment(s) within a specified time range.
 ## Attack Paths
The **Attack Paths** dashboards allows you to analyze attack paths identified by BloodHound Enterprise across your configured domains. It provides detailed information about principals that can compromise the Tier Zero Privilege Zone, their exposure levels, severity, and associated findings.
### Overview
This dashboard summarizes attack path findings (by count, severity, and frequency) across selected BloodHound tenant(s) and environment(s) within a specified time range.
All panels in this dashboard use data from the **Attack Paths** data input and share the following filters:
* BloodHound Tenant
* Environment
* Severity
* Time Range
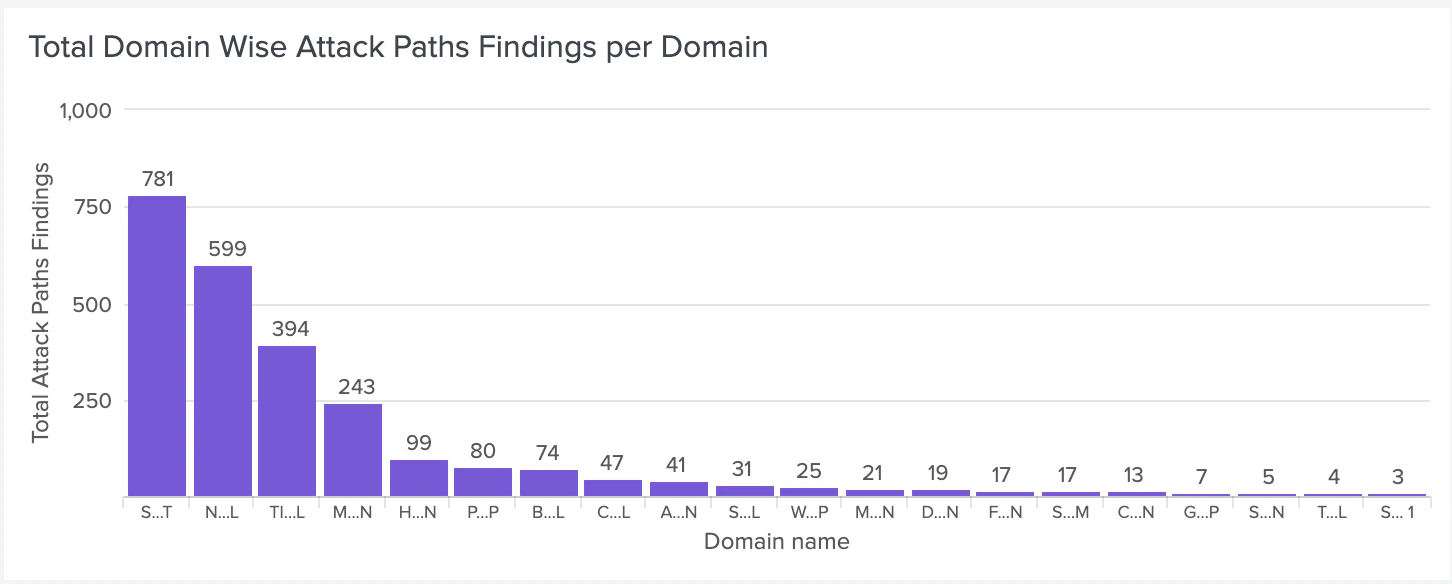
#### Total Domain Wise Attack Paths per Domain
This panel shows the total count of attack paths (by domain) identified in the selected BloodHound tenant(s) and environment(s) within a specified time range.
## Attack Paths
The **Attack Paths** dashboards allows you to analyze attack paths identified by BloodHound Enterprise across your configured domains. It provides detailed information about principals that can compromise the Tier Zero Privilege Zone, their exposure levels, severity, and associated findings.
### Overview
This dashboard summarizes attack path findings (by count, severity, and frequency) across selected BloodHound tenant(s) and environment(s) within a specified time range.
All panels in this dashboard use data from the **Attack Paths** data input and share the following filters:
* BloodHound Tenant
* Environment
* Severity
* Time Range
#### Total Domain Wise Attack Paths per Domain
This panel shows the total count of attack paths (by domain) identified in the selected BloodHound tenant(s) and environment(s) within a specified time range.
 #### Severity Breakdown
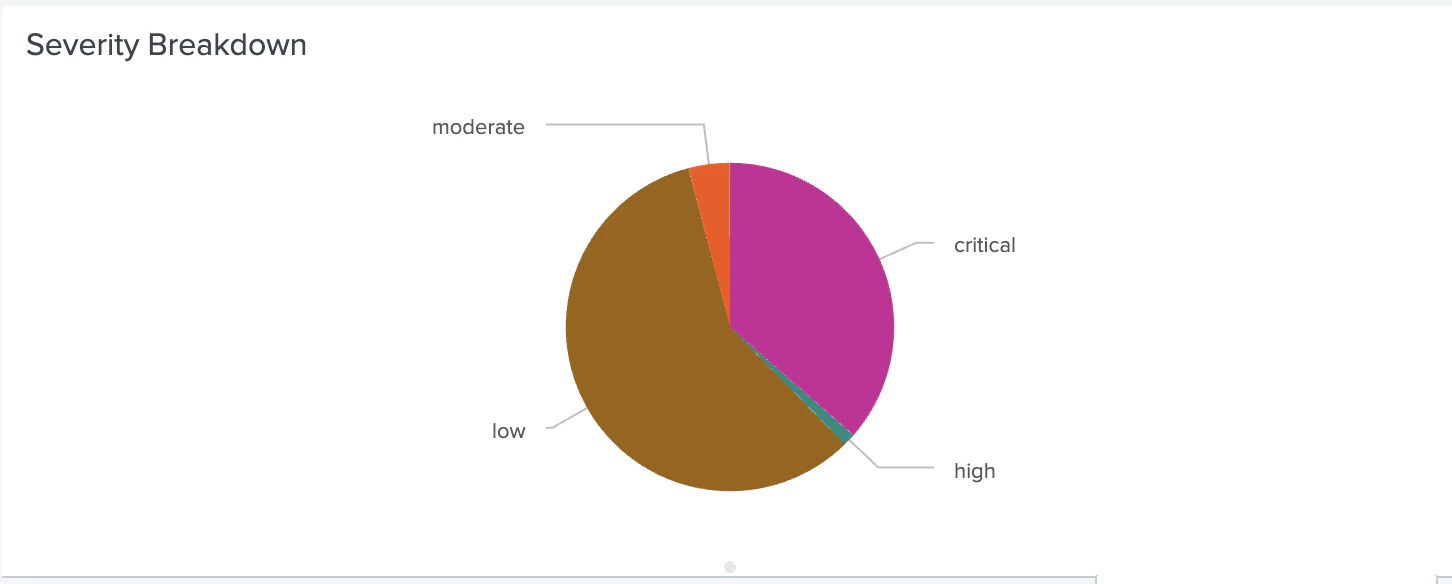
This panel shows the distribution of findings (by severity) for the selected BloodHound tenant(s) and environment(s) within a specified time range.
#### Severity Breakdown
This panel shows the distribution of findings (by severity) for the selected BloodHound tenant(s) and environment(s) within a specified time range.
 #### Top 5 Non-Tier Zero Principals Involved
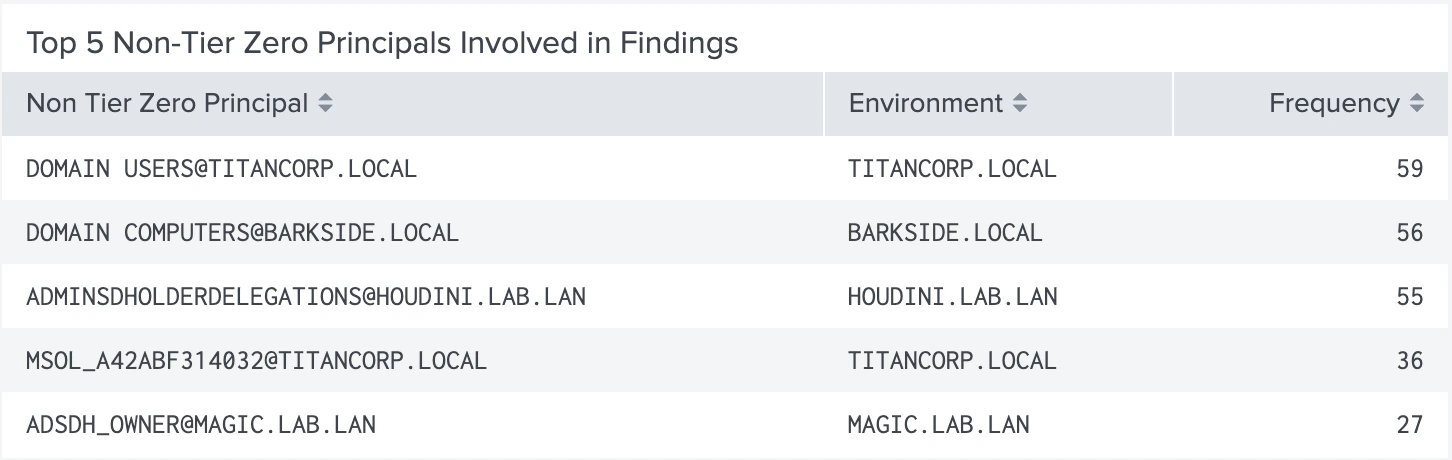
This panel shows the top five non-tier Zero principals most frequently involved in attack path findings for the selected BloodHound tenant(s) and environment(s) within a specified time range.
#### Top 5 Non-Tier Zero Principals Involved
This panel shows the top five non-tier Zero principals most frequently involved in attack path findings for the selected BloodHound tenant(s) and environment(s) within a specified time range.
 #### Top 5 Most Common Findings
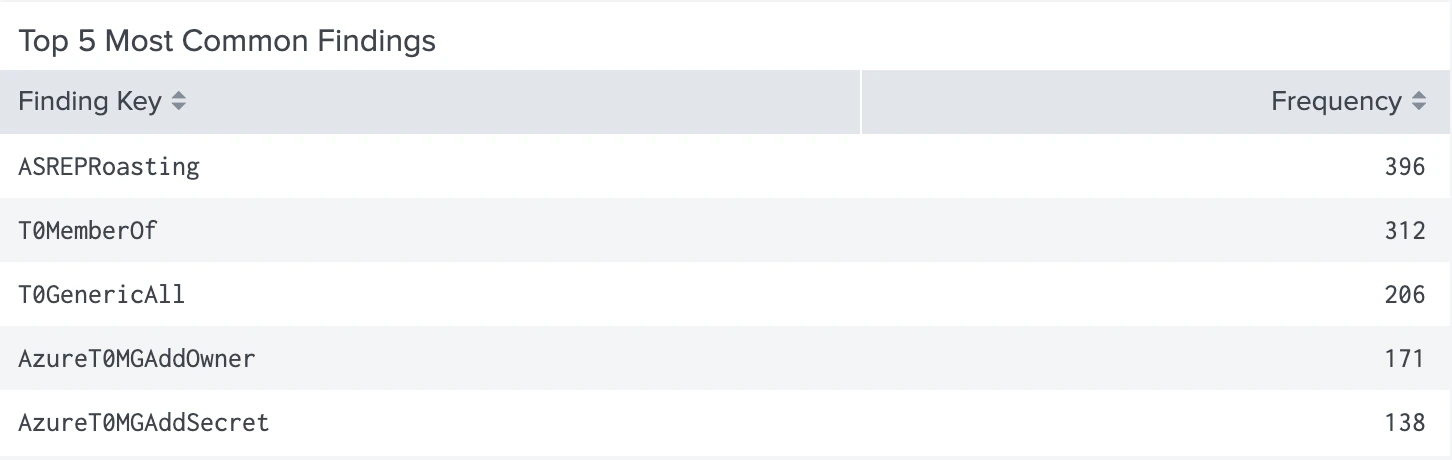
This panel shows the top five most common finding types (by frequency) for the selected BloodHound tenant(s) and environment(s) within a specified time range.
#### Top 5 Most Common Findings
This panel shows the top five most common finding types (by frequency) for the selected BloodHound tenant(s) and environment(s) within a specified time range.
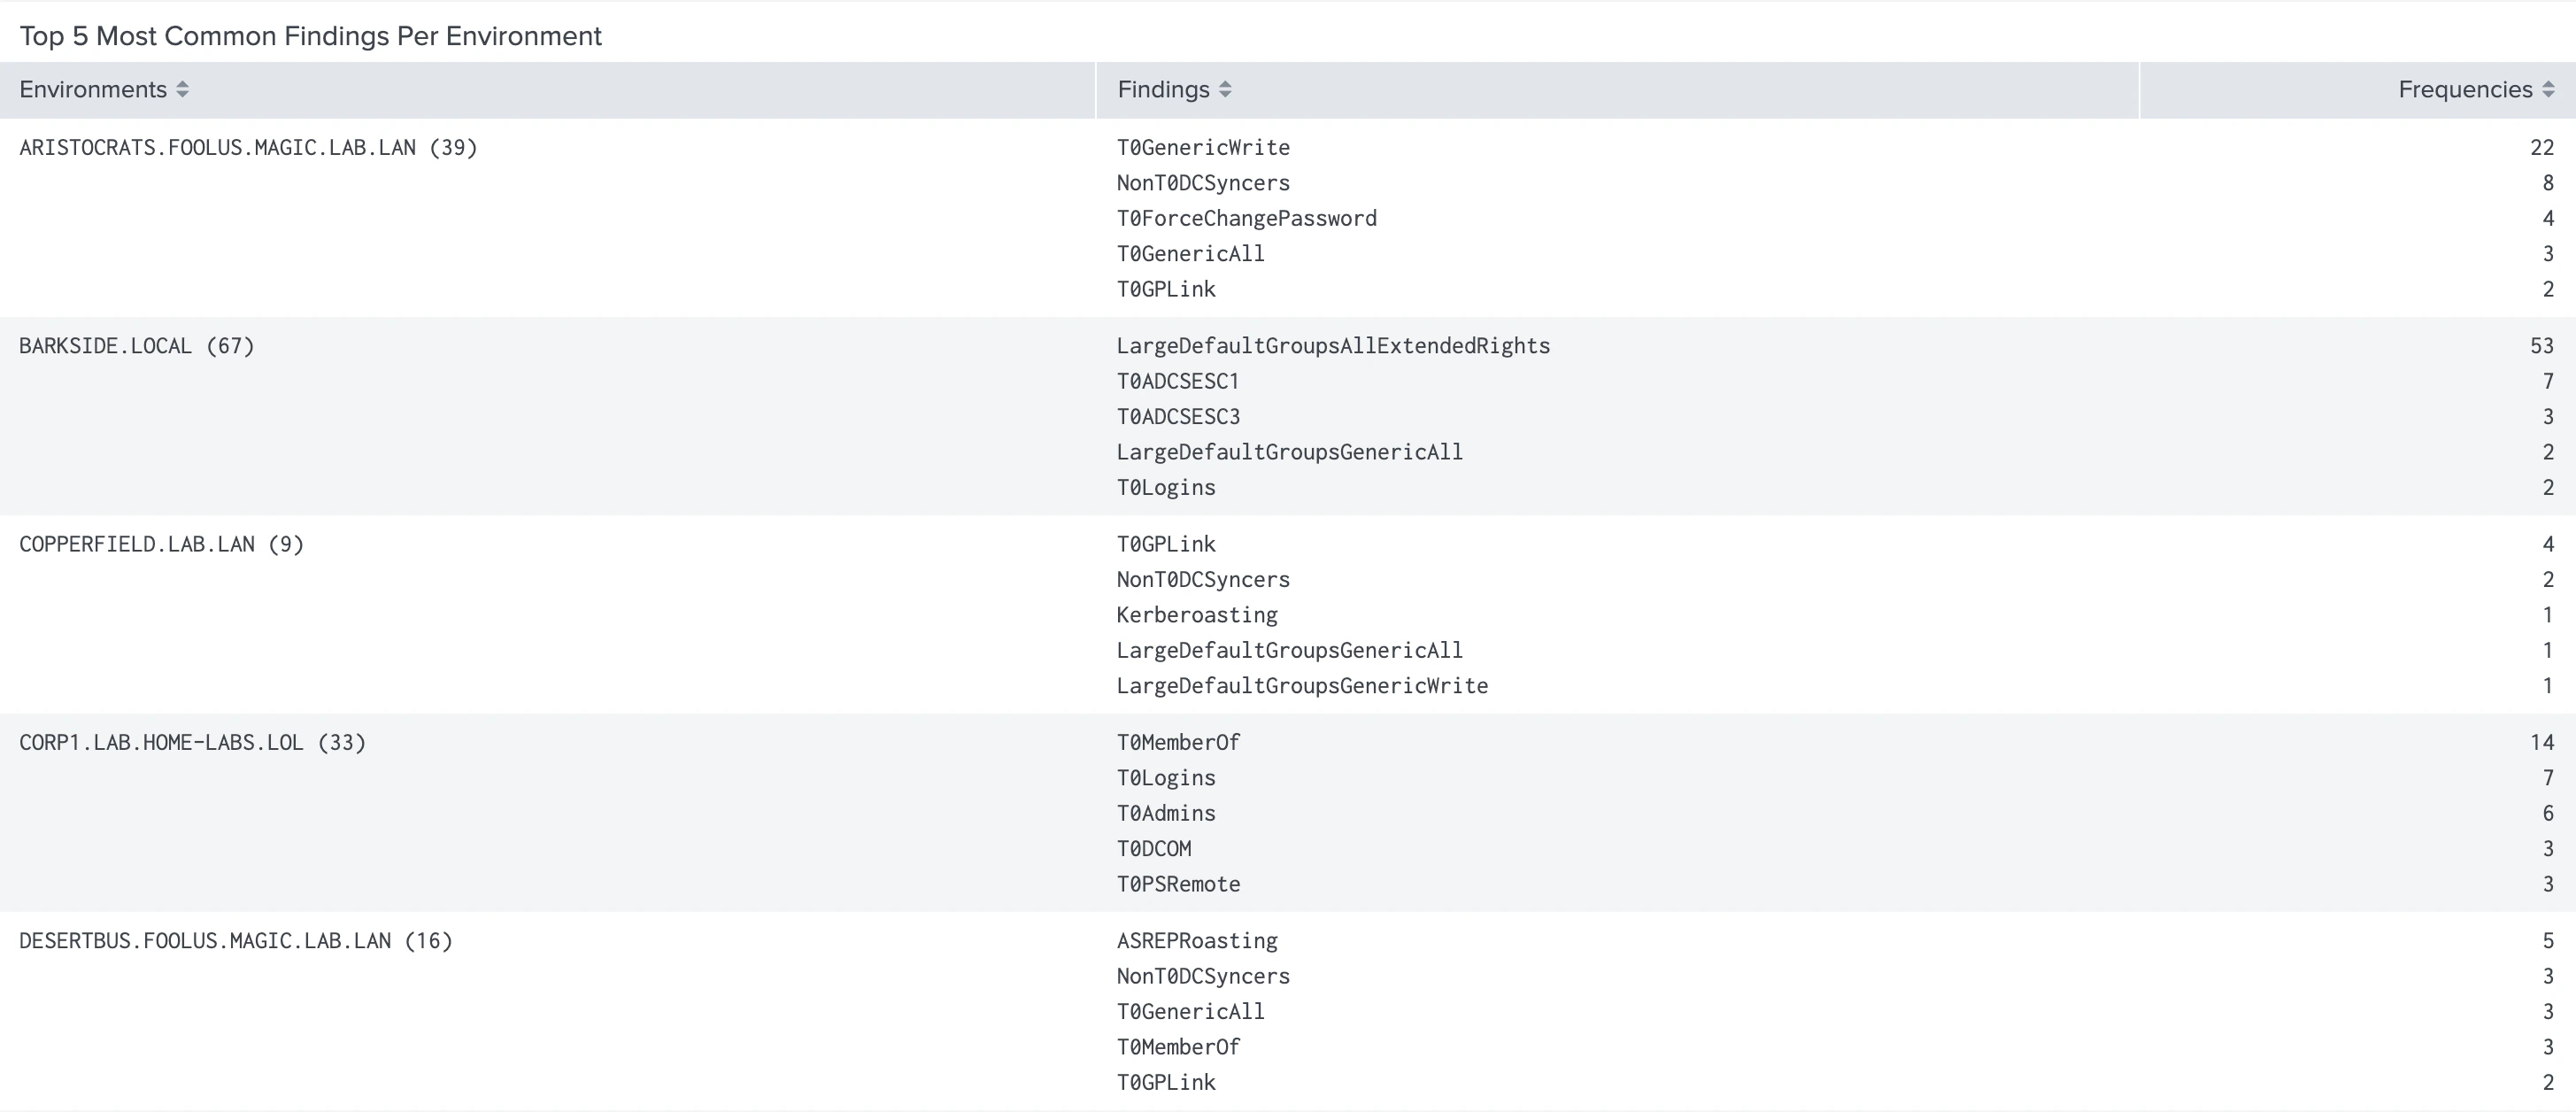
 #### Top 5 Most Common Findings Per Environment
This panel shows the top five most common finding types (by frequency) per environment for the selected BloodHound tenant(s) and environment(s) within a specified time range.
#### Top 5 Most Common Findings Per Environment
This panel shows the top five most common finding types (by frequency) per environment for the selected BloodHound tenant(s) and environment(s) within a specified time range.
 #### Top 10 Attack Paths by Exposure
This panel shows the top ten attack paths (by exposure percentage) for the selected BloodHound tenant(s) and environment(s) within a specified time range.
#### Top 10 Attack Paths by Exposure
This panel shows the top ten attack paths (by exposure percentage) for the selected BloodHound tenant(s) and environment(s) within a specified time range.
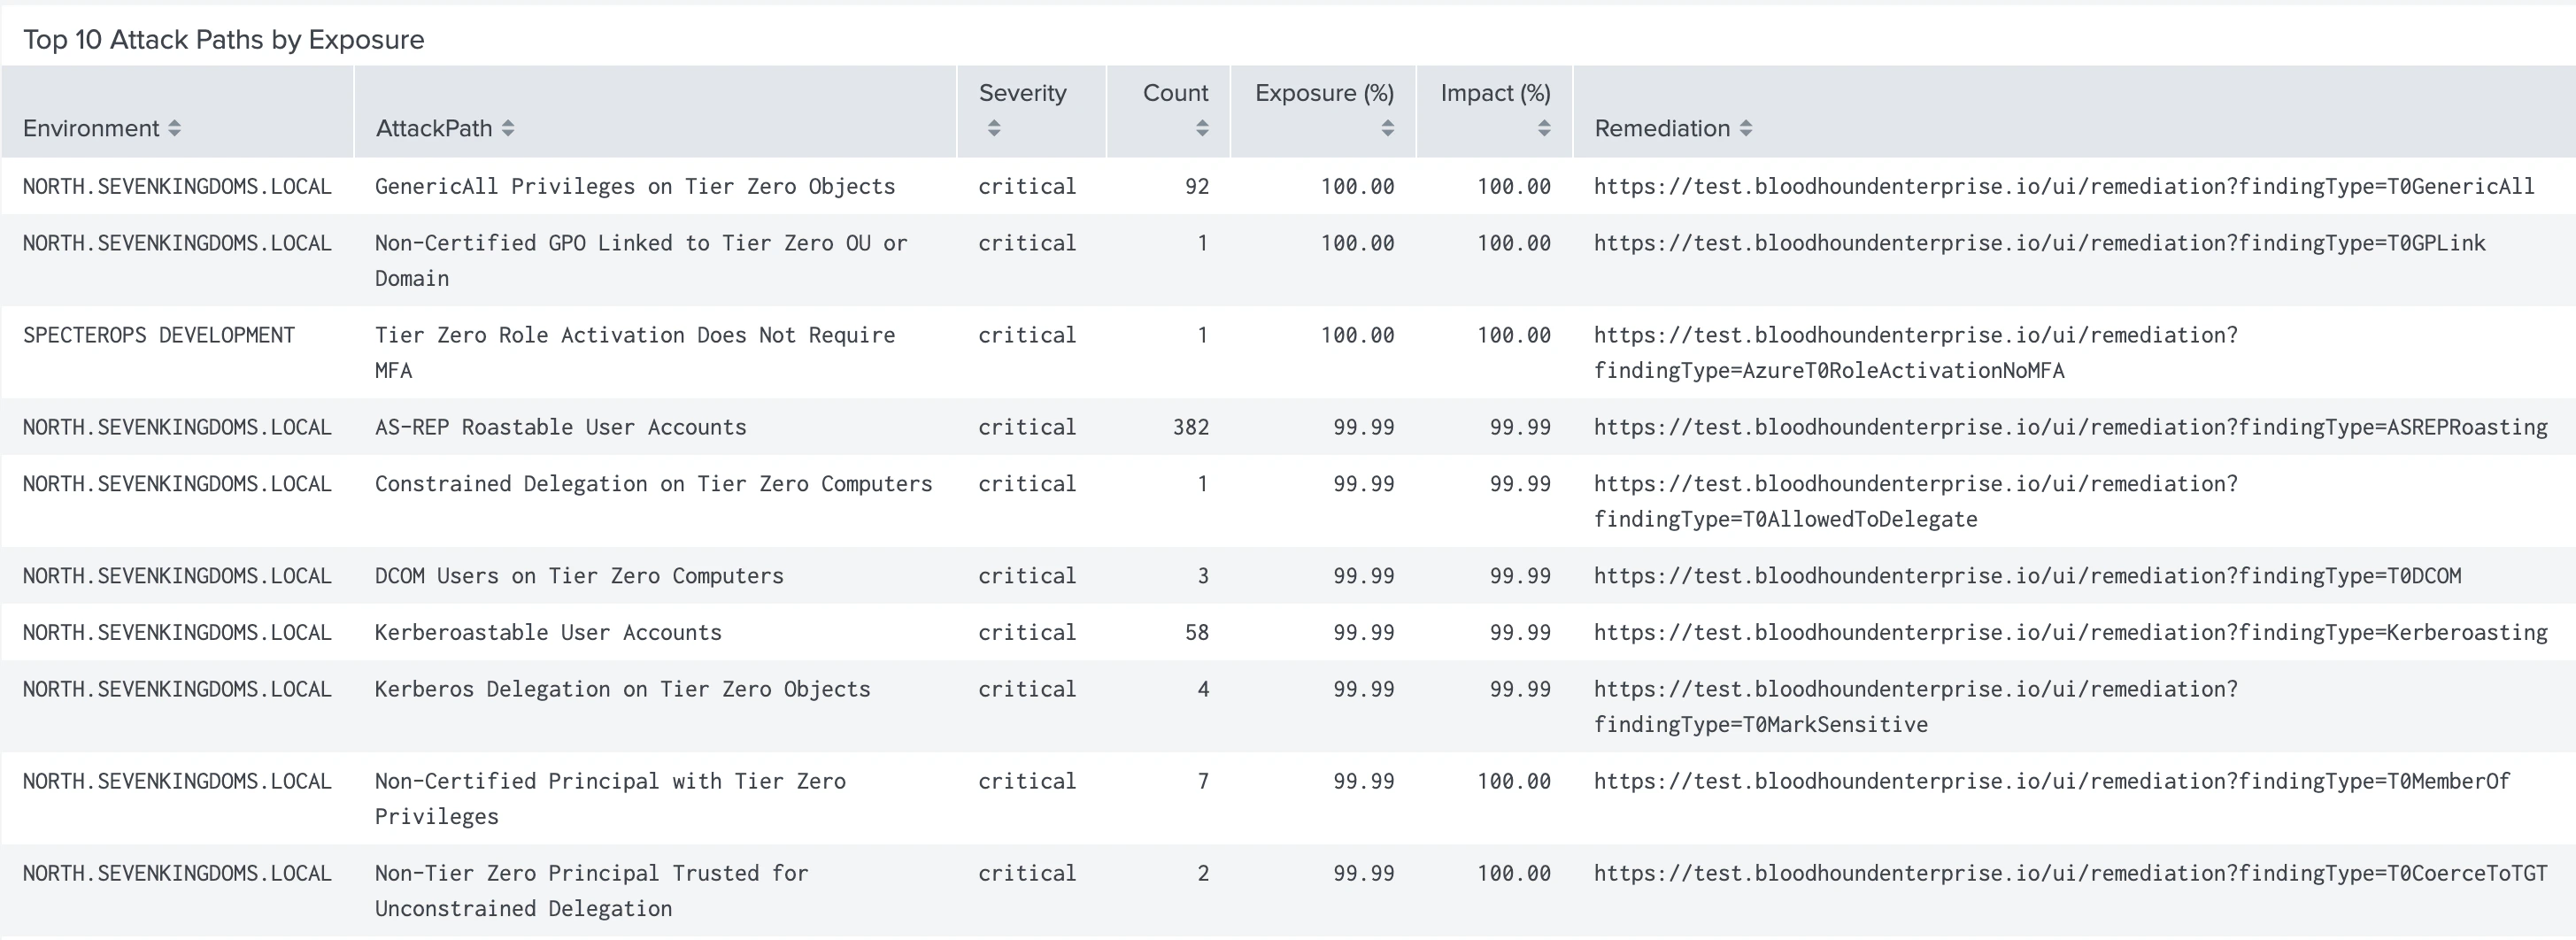 Details also include links to BloodHound Enterprise remediation documentation.
### Details
This dashboard provides more granular details about specific attack paths identified by BloodHound Enterprise. It allows you to investigate principals involved in attack paths, their exposure levels, and associated findings.
All panels in this dashboard use data from the **Attack Paths** data input and share the following filters:
* BloodHound Tenant
* Environment
* Attack Paths
* Severity
* Time Range
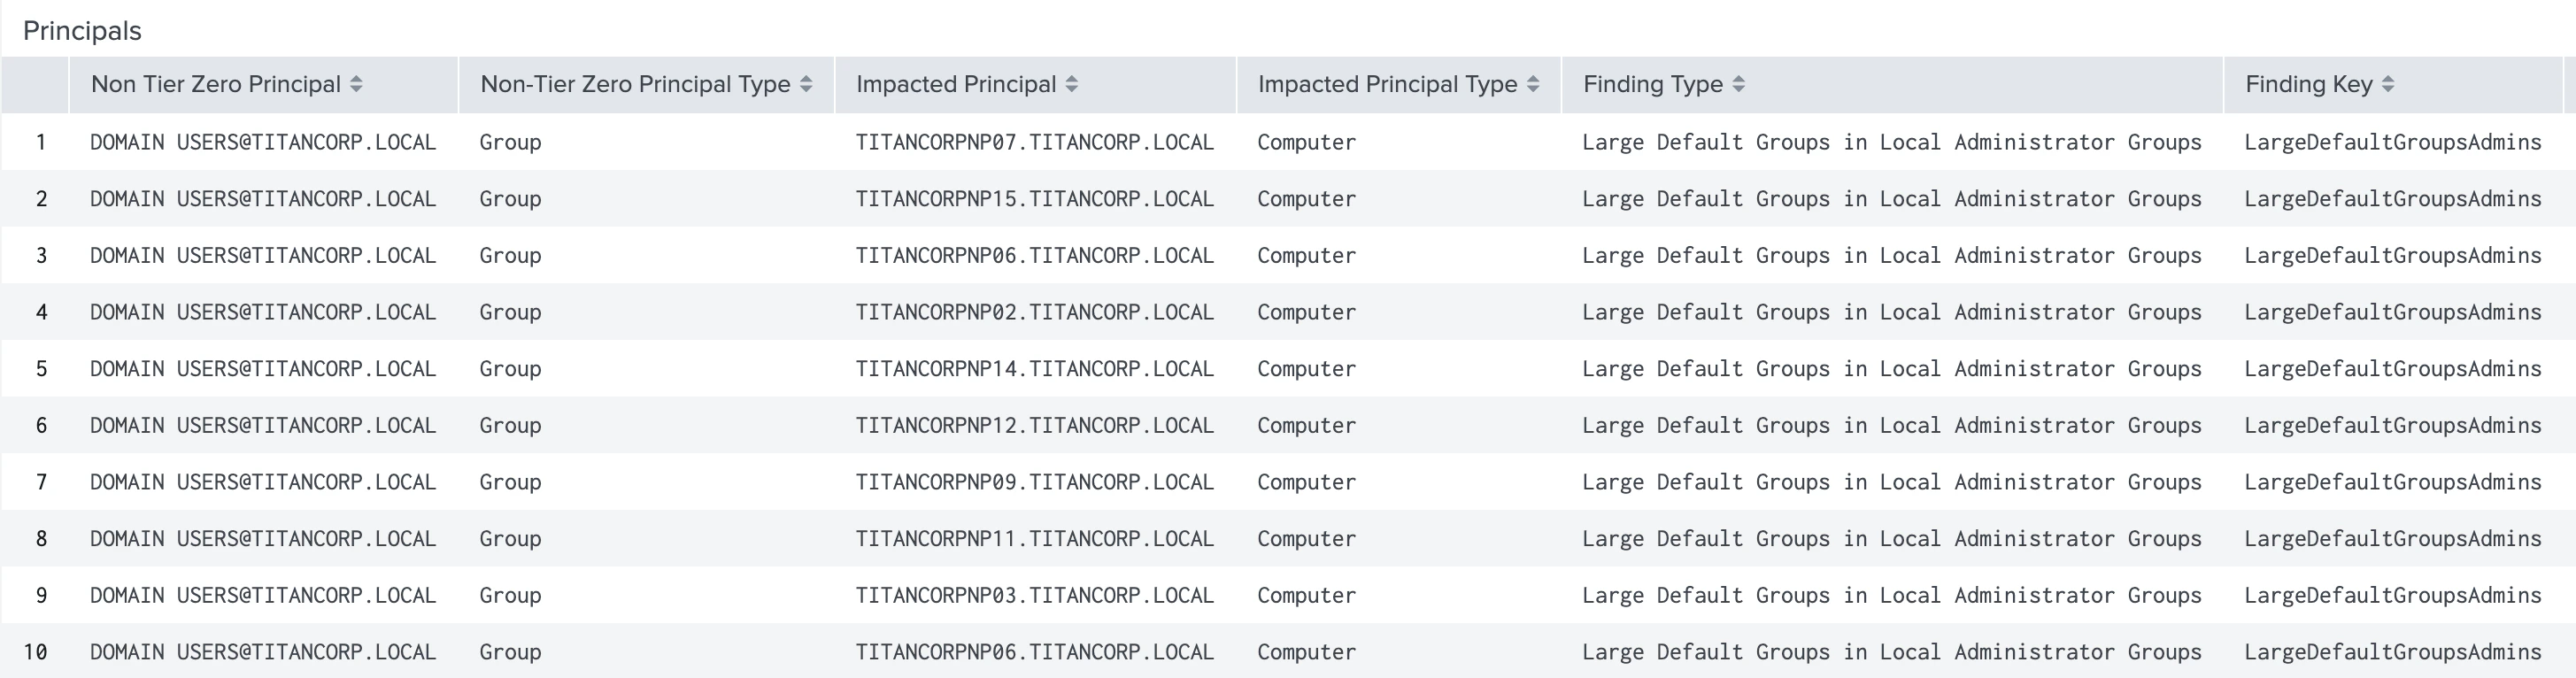
#### Principals
This panel shows all principals based on the selected filters.
It provides the following detailed information about each principal:
| | |
| ----------------------- | -------------------- |
| Non-Tier Zero Principal | Impact Count |
| Tier Zero Principal | SAM Account Name |
| Display Name | Sensitive |
| Finding Name | Last Logon |
| Distinguished Name | Last Logon Timestamp |
| Severity Level | Created Timestamp |
| Impact Percentage | First Seen |
| Last Updated | |
Details also include links to BloodHound Enterprise remediation documentation.
### Details
This dashboard provides more granular details about specific attack paths identified by BloodHound Enterprise. It allows you to investigate principals involved in attack paths, their exposure levels, and associated findings.
All panels in this dashboard use data from the **Attack Paths** data input and share the following filters:
* BloodHound Tenant
* Environment
* Attack Paths
* Severity
* Time Range
#### Principals
This panel shows all principals based on the selected filters.
It provides the following detailed information about each principal:
| | |
| ----------------------- | -------------------- |
| Non-Tier Zero Principal | Impact Count |
| Tier Zero Principal | SAM Account Name |
| Display Name | Sensitive |
| Finding Name | Last Logon |
| Distinguished Name | Last Logon Timestamp |
| Severity Level | Created Timestamp |
| Impact Percentage | First Seen |
| Last Updated | |
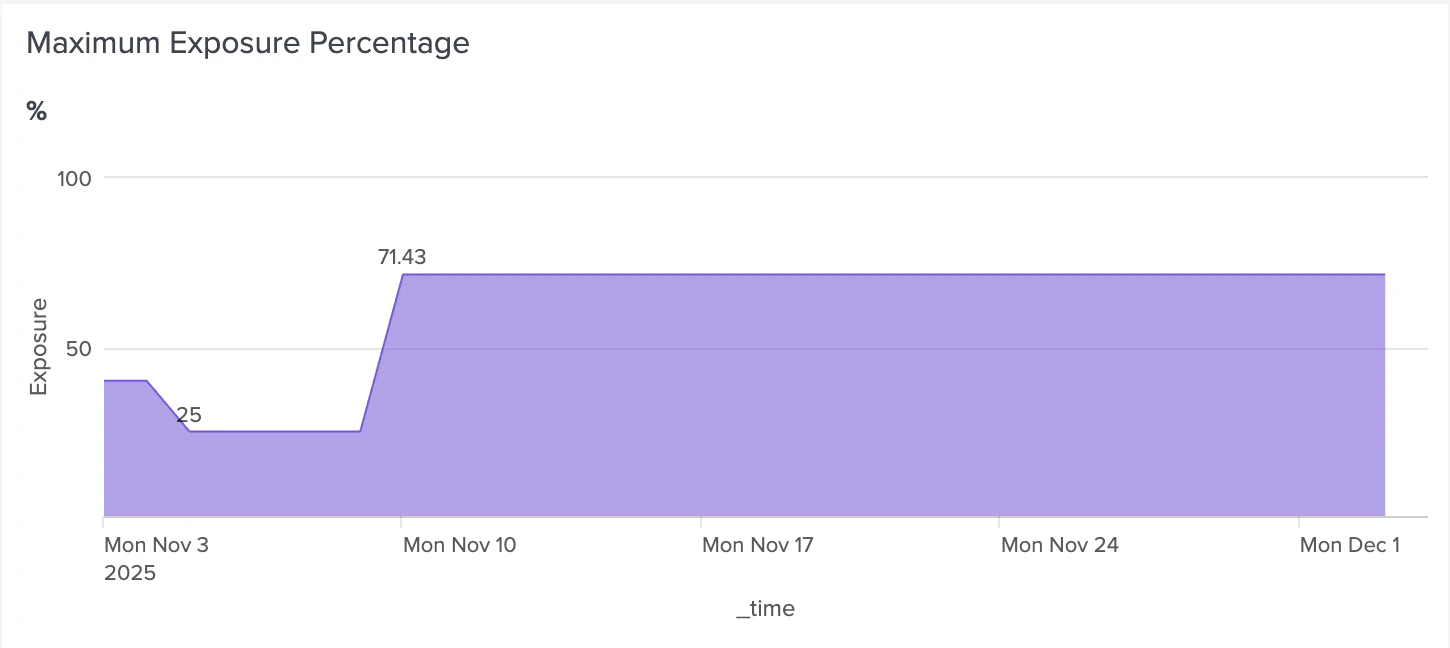
 #### Maximum Exposure Percentage
This panel shows the highest exposure (by percentage) for the specified filters.
#### Maximum Exposure Percentage
This panel shows the highest exposure (by percentage) for the specified filters.
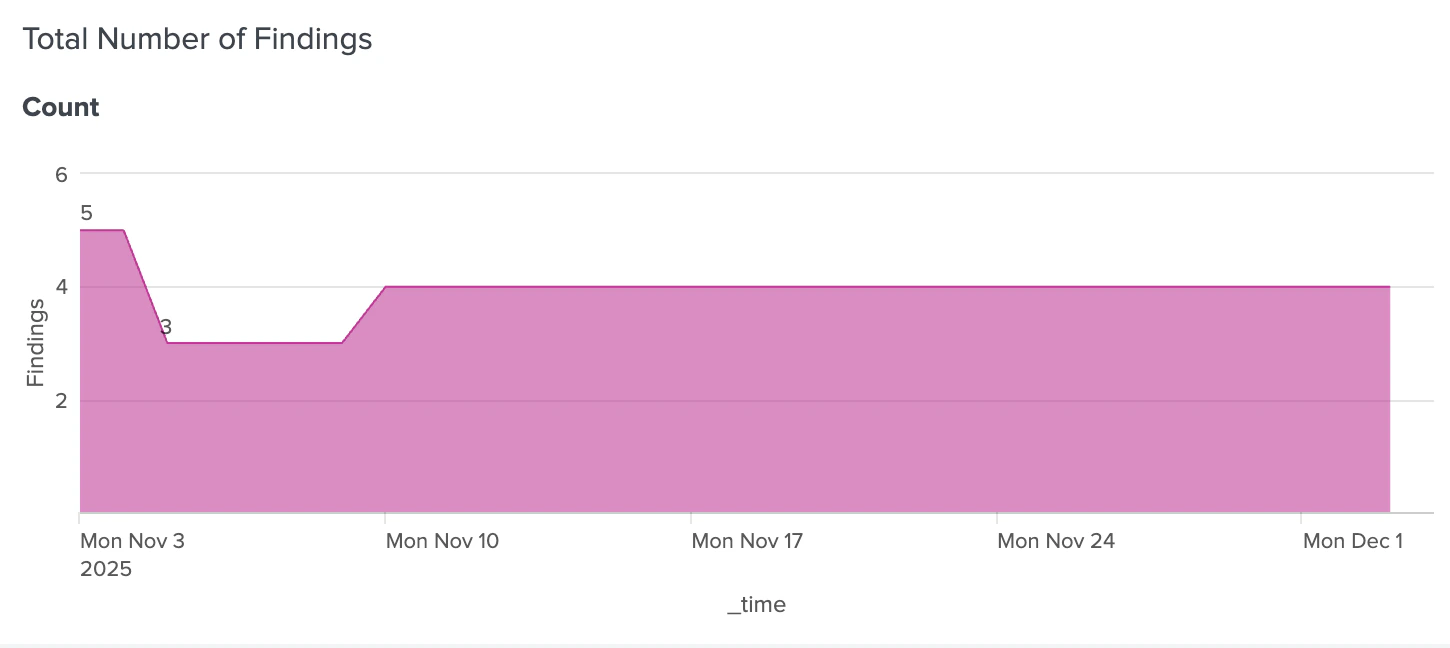
 #### Total Number of Findings
This panel shows the total number of findings (by count) for the specified filters.
#### Total Number of Findings
This panel shows the total number of findings (by count) for the specified filters.
 ### Finding Trends
This dashboard provides trend analysis of attack path findings over time. It helps you understand how the exposure and frequency of findings change over time for selected BloodHound tenant(s) and environment(s) within a specified time range.
All panels in this dashboard use data from the **Attack Paths** data input and share the following filters:
* BloodHound Tenant
* Environment
* Category
* Time Period
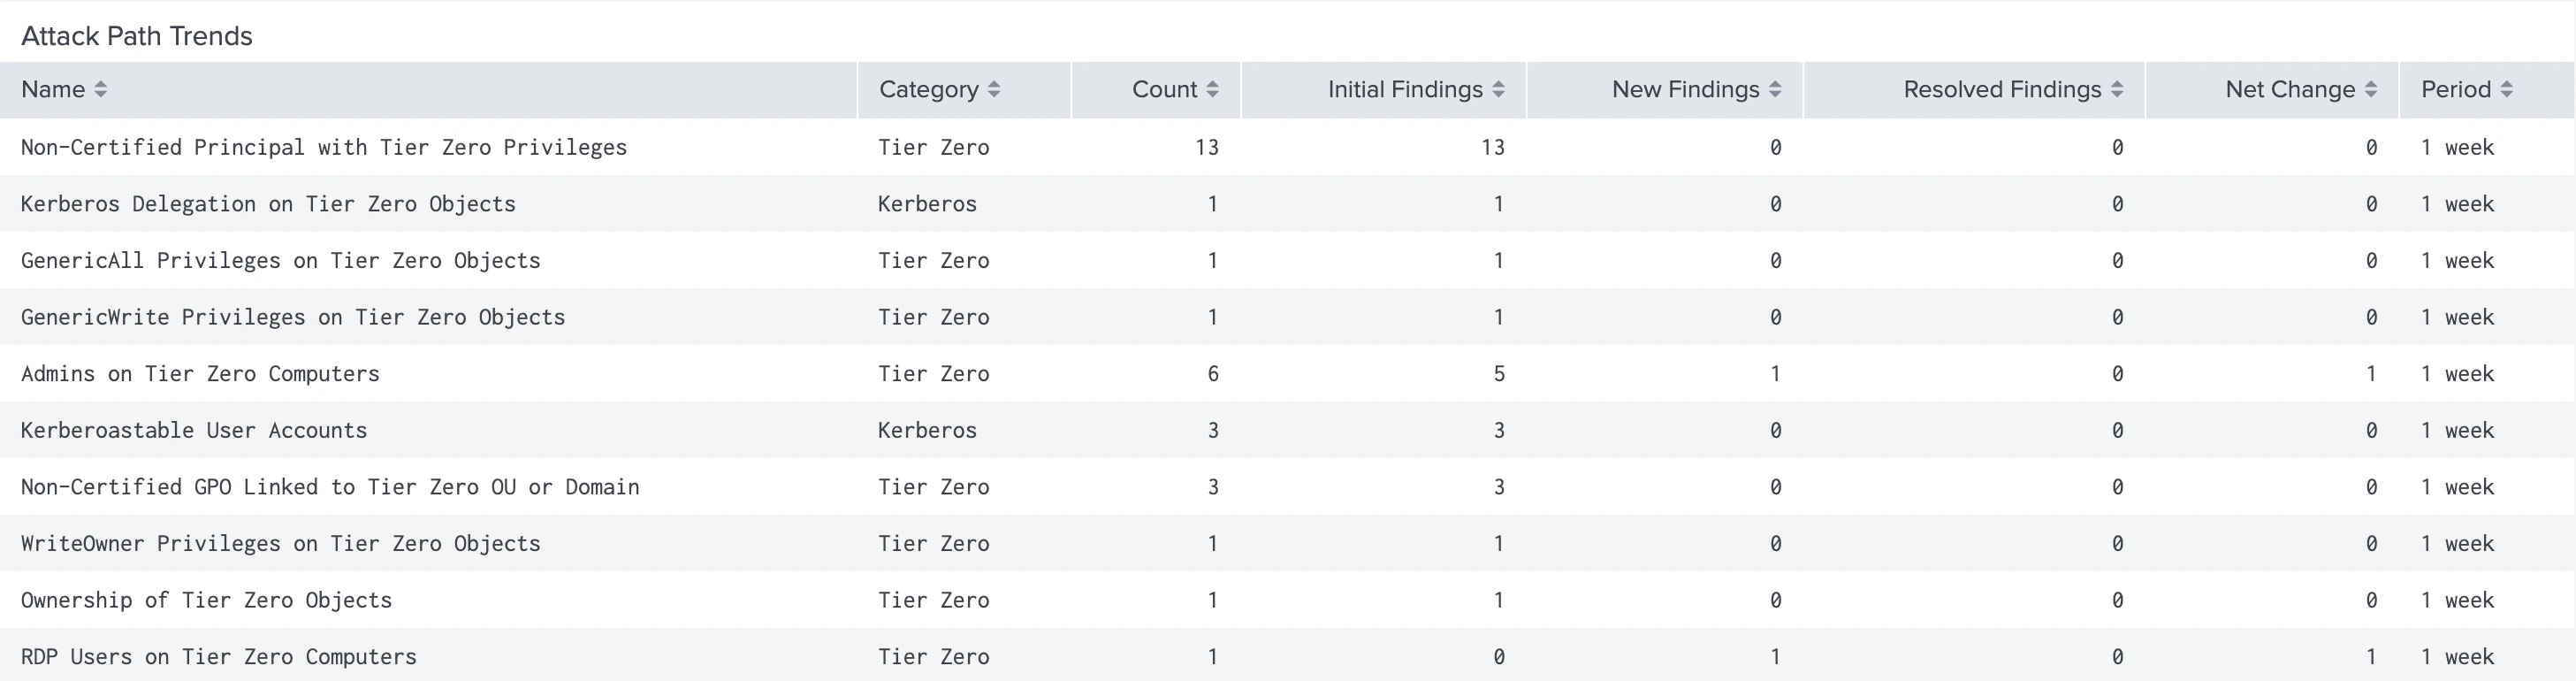
#### Attack Path Trends
This panel shows the trend (by category) of attack paths over time for the selected BloodHound tenant(s) and environment(s) within a specified time range.
Categories include:
* Tier Zero
* Kerberos
* AD Certificate Services
* Relay attacks
* Least privilege
* Entra ID
* Hybrid
* Microsoft Graph
* Azure Resource Manager
### Finding Trends
This dashboard provides trend analysis of attack path findings over time. It helps you understand how the exposure and frequency of findings change over time for selected BloodHound tenant(s) and environment(s) within a specified time range.
All panels in this dashboard use data from the **Attack Paths** data input and share the following filters:
* BloodHound Tenant
* Environment
* Category
* Time Period
#### Attack Path Trends
This panel shows the trend (by category) of attack paths over time for the selected BloodHound tenant(s) and environment(s) within a specified time range.
Categories include:
* Tier Zero
* Kerberos
* AD Certificate Services
* Relay attacks
* Least privilege
* Entra ID
* Hybrid
* Microsoft Graph
* Azure Resource Manager
 ## Audit Logs
This dashboard allows you to filter and analyze administrative and system audit events collected by BloodHound Enterprise.
All panels in this dashboard use data from the **Audit Logs** data input and share the following filters:
* BloodHound Tenant
* Event Type
* Actor Name
* Time Range
The audit log table provides the following information about each event:
| | |
| ----------------- | ------------------- |
| ID | Created At |
| Actor ID | Actor Name |
| Actor Email | Action (event type) |
| Fields | Request ID |
| Source IP address | Commit ID |
| Status | |
## Audit Logs
This dashboard allows you to filter and analyze administrative and system audit events collected by BloodHound Enterprise.
All panels in this dashboard use data from the **Audit Logs** data input and share the following filters:
* BloodHound Tenant
* Event Type
* Actor Name
* Time Range
The audit log table provides the following information about each event:
| | |
| ----------------- | ------------------- |
| ID | Created At |
| Actor ID | Actor Name |
| Actor Email | Action (event type) |
| Fields | Request ID |
| Source IP address | Commit ID |
| Status | |
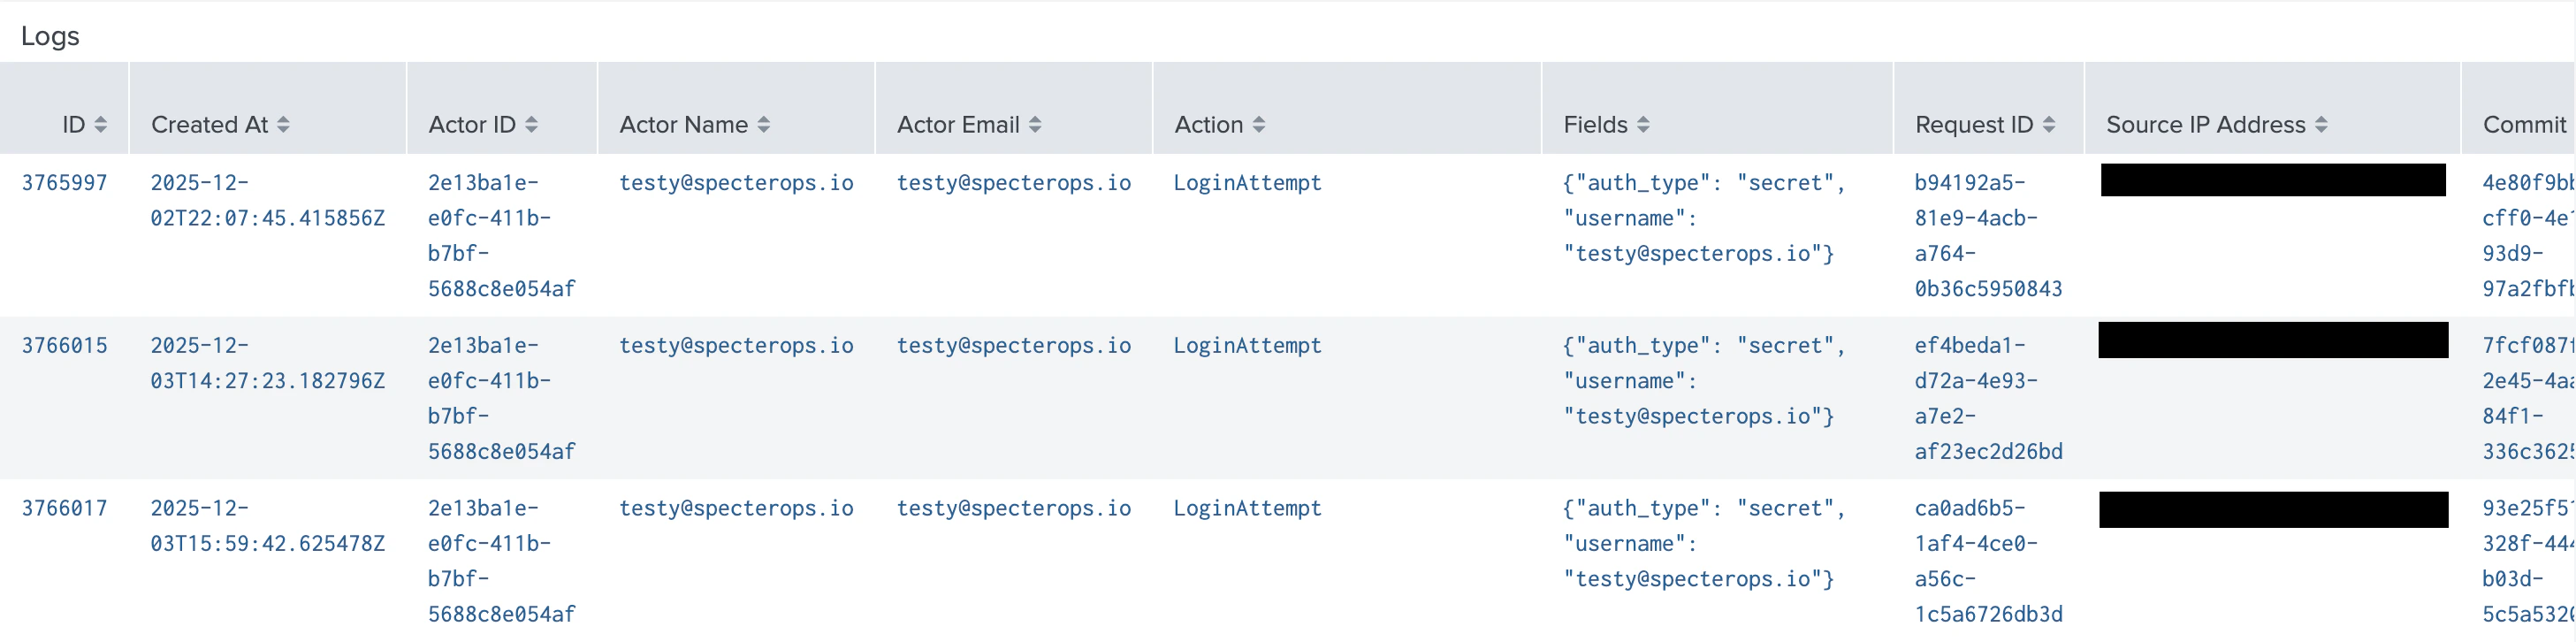 Clicking on any row in the Audit Logs table will open a detailed view of the selected audit event, providing additional context and information.
## Tier Zero Assets
This dashboard provides an inventory of Tier Zero assets identified by BloodHound Enterprise across your configured domains. It helps you analyze the distribution and details of Tier Zero assets.
All panels in this dashboard use data from the **Tier Zero Assets** data input and share the following filters:
* BloodHound Tenant
* Environment
* Type
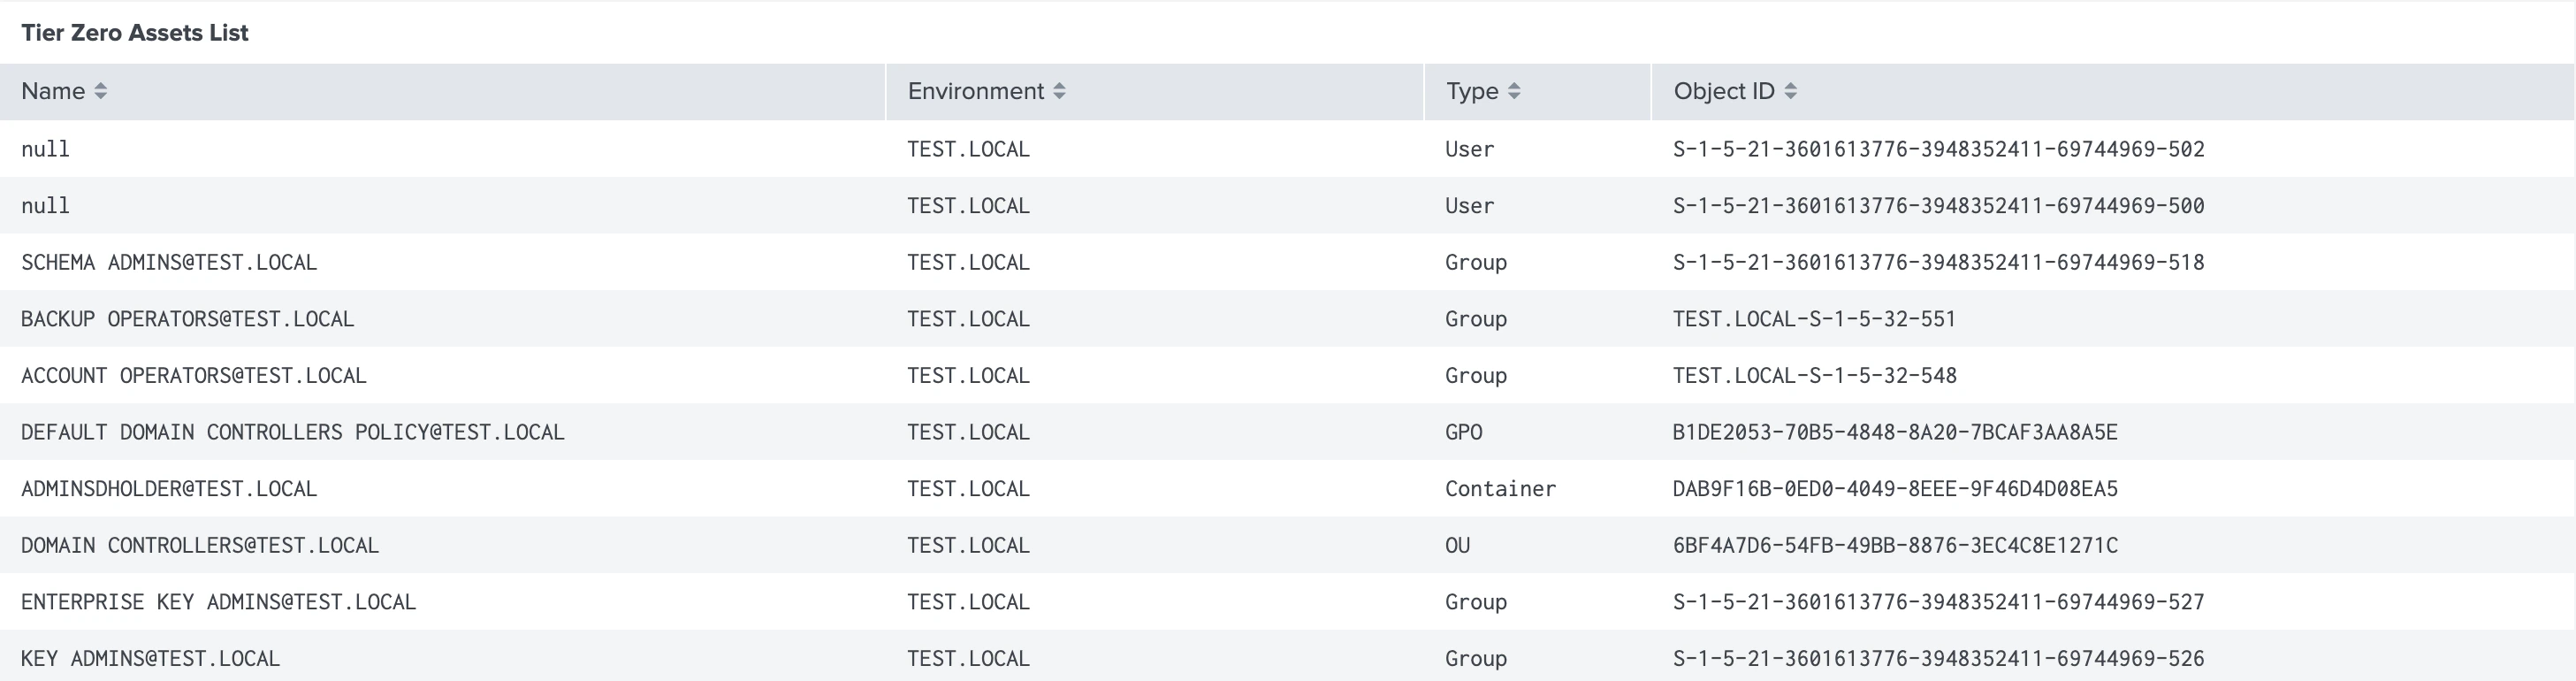
### Tier Zero Assets List
This panel provides a detailed listing of Tier Zero assets across your configured domains. It includes the following information about each asset:
* Name
* Environment
* Type
* Object ID
Clicking on any row in the Audit Logs table will open a detailed view of the selected audit event, providing additional context and information.
## Tier Zero Assets
This dashboard provides an inventory of Tier Zero assets identified by BloodHound Enterprise across your configured domains. It helps you analyze the distribution and details of Tier Zero assets.
All panels in this dashboard use data from the **Tier Zero Assets** data input and share the following filters:
* BloodHound Tenant
* Environment
* Type
### Tier Zero Assets List
This panel provides a detailed listing of Tier Zero assets across your configured domains. It includes the following information about each asset:
* Name
* Environment
* Type
* Object ID
 ### Tier Zero Assets Distribution By Environment
This panel shows how Tier Zero assets are distributed across the selected BloodHound tenant(s), environment(s), and asset type(s).
### Tier Zero Assets Distribution By Environment
This panel shows how Tier Zero assets are distributed across the selected BloodHound tenant(s), environment(s), and asset type(s).
 ## Search
See the Splunk [documentation](https://help.splunk.com/en/splunk-enterprise/search/search-manual/10.0/search-overview/get-started-with-search) for details about using Splunk Search to create custom queries and visualizations based on BloodHound Enterprise data.
## Administration
See [install and configure](/integrations/splunk/siem/install) the BloodHound Enterprise Splunk app for details about configuring data inputs and other administrative tasks.
## Search
See the Splunk [documentation](https://help.splunk.com/en/splunk-enterprise/search/search-manual/10.0/search-overview/get-started-with-search) for details about using Splunk Search to create custom queries and visualizations based on BloodHound Enterprise data.
## Administration
See [install and configure](/integrations/splunk/siem/install) the BloodHound Enterprise Splunk app for details about configuring data inputs and other administrative tasks.