> ## Documentation Index
> Fetch the complete documentation index at: https://bloodhound.specterops.io/llms.txt
> Use this file to discover all available pages before exploring further.

# Integrate BloodHound Enterprise with Splunk SIEM

> Learn how to install and configure the BloodHound Enterprise Splunk app to ingest BloodHound Enterprise data into Splunk.

<img noZoom src="https://mintcdn.com/specterops/tTIczgde9H07oLXf/assets/enterprise-edition-pill-tag.svg?fit=max&auto=format&n=tTIczgde9H07oLXf&q=85&s=b682a26b342bde12302ec829e265bdb6" alt="Applies to BloodHound Enterprise only" width="225" height="45" data-path="assets/enterprise-edition-pill-tag.svg" />

The [BloodHound Enterprise Splunk app](https://splunkbase.splunk.com/app/7818) ingests your BloodHound Enterprise data into Splunk.

* Use the dashboards to track the Active Directory and Azure attack paths of your environment
* Create alerts to detect when new attack paths emerge or exposure increases
* Enrich your security information and event management (SIEM) data with information about the attack paths to and from principals in your environment

## Prerequisites

Before you begin the installation and configuration process, ensure the following prerequisites are met:

* Splunk instance (version 9.0.1 or later) and an admin account
* BloodHound Enterprise tenant
* BloodHound Enterprise [non-personal API key/ID pair](/integrations/bloodhound-api/working-with-api#create-a-non-personal-api-key%2Fid-pair) with the **Auditor** role

## Install the app

Installing the BloodHound Enterprise Splunk app involves the following steps:
<Steps>
  <Step title="Navigate to Splunk app management">
    1. Log in to Splunk Enterprise as an admin.
    2. Click **Apps** > **Manage apps**.
  </Step>

  <Step title="Install the BloodHound Enterprise Splunk app">
    Use one of the following methods to install the BloodHound Enterprise Splunk app:

    <Tabs>
      <Tab title="Splunkbase" icon="server">
        Install directly from Splunkbase:

        1. Click **Browse More Apps**.
        2. Search for *BloodHound Enterprise*.
        3. Click **Install**
        4. Enter your Splunkbase credentials to authorize the download when prompted.
      </Tab>

      <Tab title="Downloaded package" icon="download">
        Install from a downloaded package:

        1. Download the BloodHound Enterprise Splunk app package from [Splunkbase](https://splunkbase.splunk.com/app/7818).
        2. Click **Install App from File**.
        3. Select the downloaded package and click **Upload**.
      </Tab>
    </Tabs>
  </Step>

  <Step title="Restart Splunk">
    After installing the app, restart your Splunk instance to apply the changes.

    <Tip>See [Splunk's documentation](https://help.splunk.com/en/splunk-enterprise/administer/admin-manual/9.0/welcome-to-splunk-enterprise-administration/start-splunk-enterprise-and-perform-initial-tasks/start-and-stop-splunk-enterprise) for more information.</Tip>
  </Step>
</Steps>

## Configure the app (required)

This section describes the minimum required configuration steps to get the BloodHound Enterprise Splunk app up and running. It involves the following steps:

1. Configure a Splunk index
2. Configure Splunk app API credentials
3. Configure Splunk data inputs

<Note>Optional configurations are available in the [Configure the Splunk app (optional)](#configure-the-app-optional) section.</Note>

<Steps>
  <Step title="Configure a Splunk index">
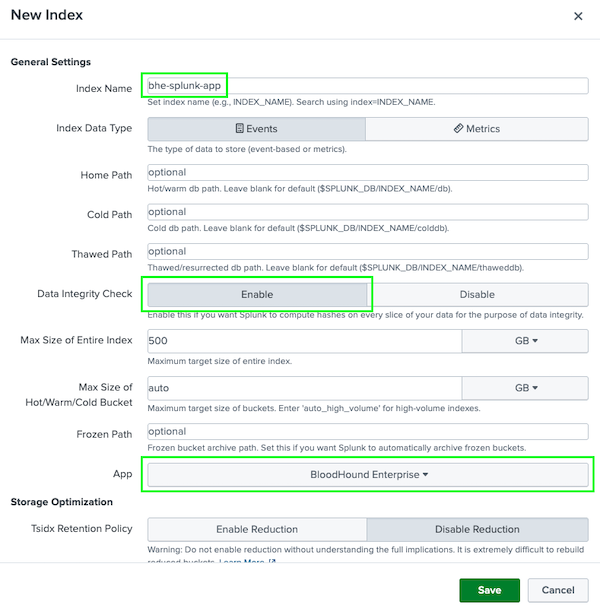
    Create a dedicated index for the BloodHound Enterprise Splunk app data:

    1. Click **Settings** > **Indexes** > **New Index**.
    2. In the **Index Name** field, enter `bhe-splunk-app`.
    3. In the **Data Integrity Check** field, select **Enabled**.
    4. In the **App** field, select **BloodHound Enterprise**.
    5. Click **Save**.

           <Frame>
             <img src="https://mintcdn.com/specterops/1w44dPwHX0hJEUPb/images/integrations/splunk/siem/new-index-config.png?fit=max&auto=format&n=1w44dPwHX0hJEUPb&q=85&s=3426d9f94136f09847b9ad1d432e6892" style={{ width:"70%" }} alt="A view of the Splunk 'New Index' configuration page showing the fields filled out for creating the 'bhe-splunk-app' index." width="600" height="611" data-path="images/integrations/splunk/siem/new-index-config.png" />
           </Frame>
  </Step>

  <Step title="Configure Splunk app API credentials">
    Configure the BloodHound Enterprise Splunk app with your BloodHound Enterprise API credentials.

    <Note>We recommend a [non-personal API key/ID pair](/integrations/bloodhound-api/working-with-api#create-a-non-personal-api-key%2Fid-pair) with the **Auditor** role for the Splunk integration.</Note>

    1. Click **Apps** > **Manage Apps**.

    2. Filter for the BloodHound Enterprise Splunk app and click on it.

    3. Click the **Administration** drop-down menu and select **Configuration**.

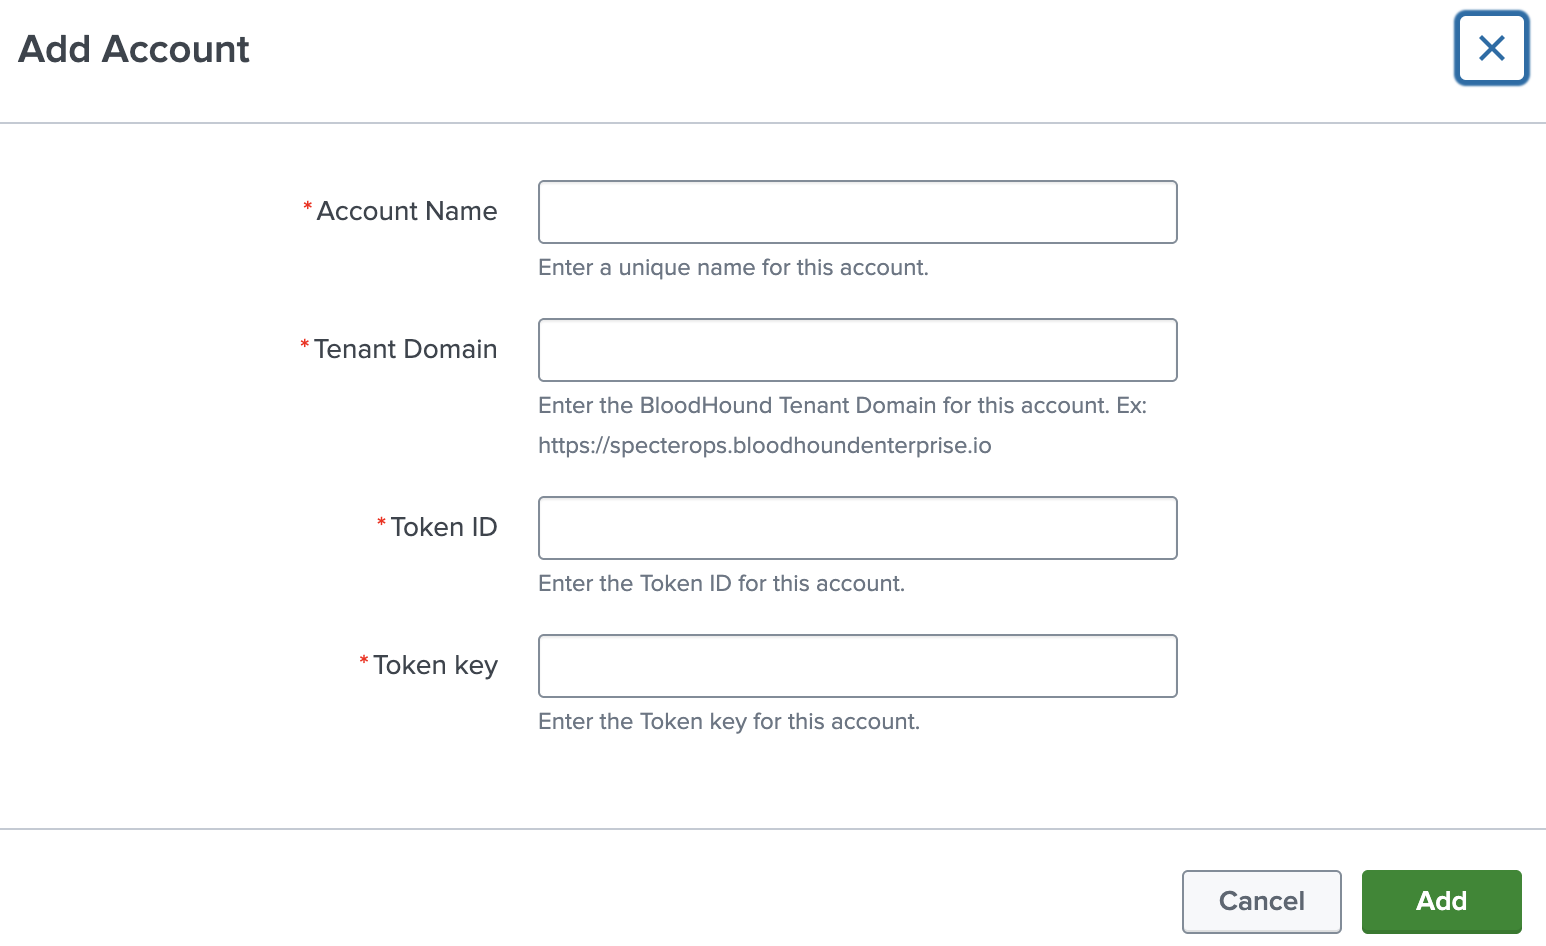
    4. Click **Add** to open the **Add Account** screen.

    5. Complete the configuration fields:

       | Field             | Description                                                                          |
       | ----------------- | ------------------------------------------------------------------------------------ |
       | **Account Name**  | Unique name to identify the BloodHound Enterprise account in Splunk                  |
       | **Tenant Domain** | Your BloodHound Enterprise tenant (e.g., `https://mydomain.bloodhoundenterprise.io`) |
       | **Token ID**      | Token ID associated with the BloodHound Enterprise account                           |
       | **Token key**     | Token key associated with the BloodHound Enterprise account                          |

    6. Click **Save** to apply the configuration.

           <Frame>
             <img src="https://mintcdn.com/specterops/1w44dPwHX0hJEUPb/images/integrations/splunk/siem/add-account.png?fit=max&auto=format&n=1w44dPwHX0hJEUPb&q=85&s=541d5abc990fd02caf7a8df80247dbc4" style={{ width:"70%" }} alt="A view of the Splunk 'Add Account' page showing the fields configuring the app's API credentials." width="1546" height="946" data-path="images/integrations/splunk/siem/add-account.png" />
           </Frame>
  </Step>

  <Step title="Configure data inputs">
    Data inputs define what data the BloodHound Enterprise Splunk app collects from the BloodHound Enterprise API.

    <Tip>You can create multiple inputs of the same type, each with different configurations (e.g., different BloodHound Enterprise accounts, indices, and collection intervals).</Tip>

    1. Click **Apps** > **Manage Apps**.

    2. Filter for the BloodHound Enterprise Splunk app and click on it.

    3. Click the **Administration** drop-down menu and select **Inputs**.

    4. Click **Create New Input**.

    5. Select an input type from the drop-down menu.

       The BloodHound Enterprise Splunk app supports the following input types:

           <table style={{ tableLayout: 'auto' }}>
             <thead>
               <tr>
                 <th style={{ textAlign: 'left' }}>Input type</th>
                 <th style={{ textAlign: 'left' }}>Description</th>
               </tr>
             </thead>

             <tbody>
               <tr>
                 <td><strong>Attack Paths</strong></td>
                 <td>Retrieves a list of attack paths from the BloodHound Enterprise API and a list of various findings across a given time range.</td>
               </tr>

               <tr>
                 <td><strong>Audit Logs</strong></td>

                 <td>
                   Retrieves a list of audit logs from the BloodHound Enterprise API.

                   <ul>
                     <li>Requires the API user to have either the <strong>Administrator</strong> or <strong>Auditor</strong> role in BHE.</li>
                     <li>You can set the "Historical Polling Days" field to retrieve logs from the past N days, starting from the current date.</li>
                     <li>After the app fetches all logs for the specified period, the input continues polling only the latest audit logs.</li>
                     <li>If you need logs from a different time range, you can create a new input and fetch them separately.</li>
                   </ul>
                 </td>
               </tr>

               <tr>
                 <td><strong>Tier Zero Assets</strong></td>
                 <td>Ingests data for all asset members that belong to the Tier Zero privilege zone.</td>
               </tr>

               <tr>
                 <td><strong>Posture Statistics</strong></td>
                 <td>Retrieves a history of statistics stored in the database using the BloodHound Enterprise API.</td>
               </tr>
             </tbody>
           </table>

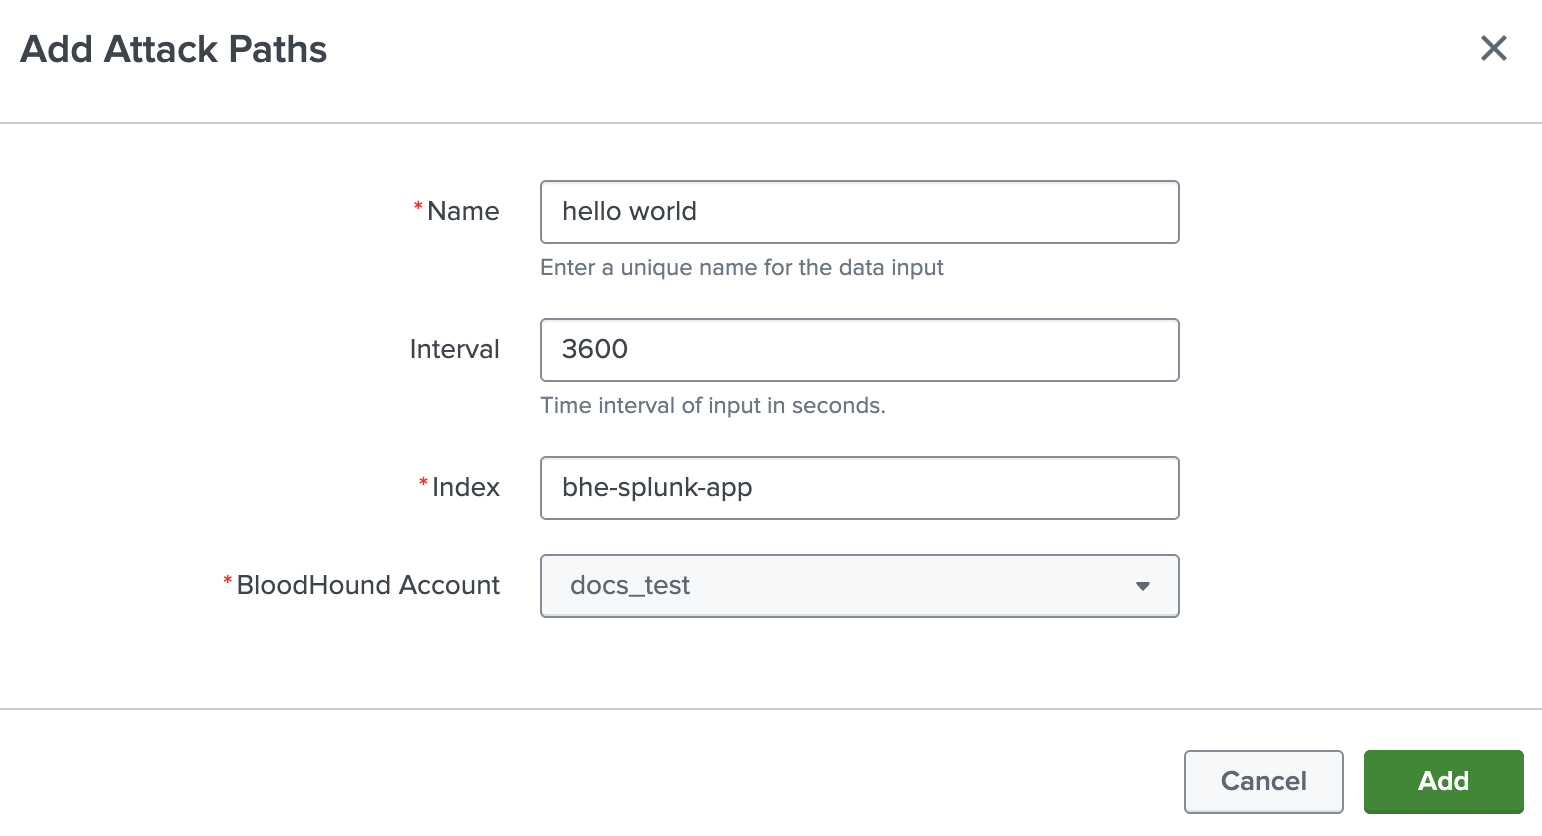
    6. Complete the configuration fields for the selected input type.

       The following table describes fields that are common across all input types:

       | Field                  | Description                                                                                                                                   |
       | ---------------------- | --------------------------------------------------------------------------------------------------------------------------------------------- |
       | **Name**               | Unique name identifying the input                                                                                                             |
       | **Interval**           | Interval (in seconds) at which the input runs                                                                                                 |
       | **Index**              | Index where the BloodHound Enterprise data is stored (`bhe-splunk-app`). You must clear the `default` value and search for the correct index. |
       | **Bloodhound Account** | BloodHound Enterprise account name (configured in Splunk) that will be used to fetch the data                                                 |

    7. Click **Add** to create the input.

           <Frame>
             <img src="https://mintcdn.com/specterops/1w44dPwHX0hJEUPb/images/integrations/splunk/siem/input-config.png?fit=max&auto=format&n=1w44dPwHX0hJEUPb&q=85&s=bf5e9f6b72d3f7cb1e1a8991e20270ac" style={{ width:"70%" }} alt="A view of the Splunk 'Create New Input' configuration page showing the fields filled out for creating a new input." width="1542" height="836" data-path="images/integrations/splunk/siem/input-config.png" />
           </Frame>

       Repeat the above steps to create additional inputs as needed.

       Data will now begin flowing into the environment. You can monitor this progress through Splunk itself with the following query:

       ```spl theme={null}
       index=_internal source="*splunkd.log" "BHE "
       ```

  </Step>
</Steps>

## Configure the app (optional)

This section describes optional configuration options for the BloodHound Enterprise Splunk app,  including:

1. Configure a Splunk search macro
2. Configure a Splunk proxy
3. Configure Splunk logging

<Steps>
  <Step title="Configure search macro">
    The BloodHound Enterprise Splunk app includes a [search macro](https://help.splunk.com/en/splunk-enterprise/manage-knowledge-objects/knowledge-management-manual/9.4/search-macros/use-search-macros-in-searches) (`bhe_index`) that points to the default index where Splunk stores BloodHound Enterprise data (`bhe-splunk-app`).

    <Frame>
      <img src="https://mintcdn.com/specterops/HbCgAIdv_OAN1gyR/images/integrations/splunk/siem/search-macro.png?fit=max&auto=format&n=HbCgAIdv_OAN1gyR&q=85&s=462715ade7e62760c1efbd8d883f3219" alt="A view of the Splunk 'Search Macros' page showing the default 'bhe_index' macro." width="2936" height="434" data-path="images/integrations/splunk/siem/search-macro.png" />
    </Frame>

    To view or modify the search macro:

    1. Click **Settings** > **Advanced search**.
    2. Click **Search macros**.
    3. Filter for `bhe_index`.

       If you used a different index name, edit the macro **Definition** field to match that name.

       ```spl theme={null}
       index=my_custom_bhe_index
       ```

       If you maintain separate indexes per input type, modify the macro definition accordingly. For example:

       ```spl theme={null}
       index=attack_path_index OR index=audit_log_index OR index=posture_stats_index
       ```
  </Step>

  <Step title="Configure a proxy">
    Splunk allows you to configure a proxy to route traffic through an intermediary server. This might be useful for network security and compliance requirements.

    1. Click **Apps** > **Manage Apps**.

    2. Filter for the BloodHound Enterprise Splunk app and click on it.

    3. Click the **Administration** drop-down menu and select **Configuration**.

    4. Click the **Proxy Settings** tab.

    5. Complete the configuration fields:

       | Field          | Description                                                     |
       | -------------- | --------------------------------------------------------------- |
       | **Enable**     | Checkbox to enable or disable the proxy configuration           |
       | **Proxy Type** | Drop-down to choose the type of proxy (http, socks4, socks5)    |
       | **Host**       | Enter the proxy hostname or IP address                          |
       | **Port**       | Specify the port number (e.g., 8080)                            |
       | **Username**   | If authentication is required, enter the username               |
       | **Password**   | If authentication is required, enter the corresponding password |

    6. Click **Save** to apply the proxy settings.

    7. Restart Splunk.

       <Tip>See [Splunk's documentation](https://help.splunk.com/en/splunk-enterprise/administer/admin-manual/9.0/welcome-to-splunk-enterprise-administration/start-splunk-enterprise-and-perform-initial-tasks/start-and-stop-splunk-enterprise) for more information.</Tip>
  </Step>

  <Step title="Configure logging">
    You can configure logging settings for the BloodHound Enterprise Splunk app to help with troubleshooting and monitoring.

    1. Click **Apps** > **Manage Apps**.

    2. Filter for the BloodHound Enterprise Splunk app and click on it.

    3. Click the **Administration** drop-down menu and select **Configuration**.

    4. Click the **Logging** tab.

    5. Select one of the following options from the **Log level** drop-down menu:

       | Log level   | Description                           |
       | ----------- | ------------------------------------- |
       | **DEBUG**   | Most verbose; use for troubleshooting |
       | **INFO**    | Standard logs (default)               |
       | **WARNING** | Warnings only                         |
       | **ERROR**   | Errors only                           |

    6. Click **Save** to apply the changes.

    The BloodHound Enterprise Splunk app writes logs to:

    ```text theme={null}
    $SPLUNK_HOME/var/log/splunk/ta_bloodhound_enterprise_<input-name>.log
    ```

    You can search logs in Splunk using:

    ```spl theme={null}
    index="_internal" sourcetype="ta_bloodhound_enterprise:log"
    ```

    Use the `tail` command to monitor logs in real-time:

    ```bash theme={null}
    tail -f $SPLUNK_HOME/var/log/splunk/ta_bloodhound_enterprise_<input-name>.log
    ```
  </Step>
</Steps>

## Monitor and troubleshoot

The **BHE Integration Health** dashboard is designed to help you monitor and troubleshoot errors related to the BloodHound Enterprise Splunk app.

This dashboard provides real-time insights into the system failures, allowing you to quickly identify and resolve issues. It retrieves and displays error logs with the following Splunk query:

```spl theme={null}
index=bhe-splunk-app sourcetype=BHE:error
```

<Note>This dashboard does not provide filters.</Note>

Here are some recommendations for using the **BHE Integration Health** dashboard to troubleshoot issues:

* Identify the function causing the error in the Detailed Error Logs table
* Look for recurring errors in Error Summary and Top Error Functions
* Apply the relevant steps above based on the error type
* If issues persist, inspect Splunk internal logs

<Note>See [Troubleshooting](/integrations/splunk/siem/troubleshoot) for common issues and resolutions.</Note>

To access the **BHE Integration Health** Dashboard:

1. Log in to Splunk Enterprise as an admin.
2. Click **Apps** > **Manage apps**.
3. Filter for the BloodHound Enterprise Splunk app and click on it.
4. Click the **Administration** drop-down menu and select **BHE Integration Health Dashboard**.

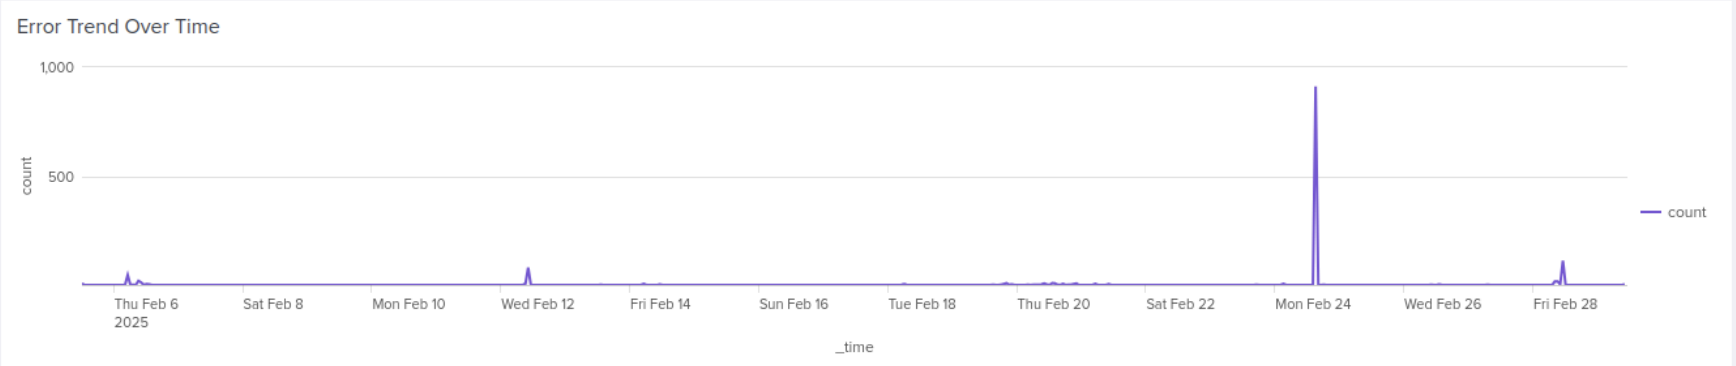
### Error Trend Over Time

This panel shows which functions are generating the most errors in the BloodHound Enterprise Splunk app.

<Frame>
  <img src="https://mintcdn.com/specterops/1w44dPwHX0hJEUPb/images/integrations/splunk/siem/error-trend-over-time.png?fit=max&auto=format&n=1w44dPwHX0hJEUPb&q=85&s=7b7f15f2efd2d73ae24bfe323b5b8920" alt="A view of the Error Trend Over Time panel in the BloodHound Enterprise Splunk app" width="1736" height="366" data-path="images/integrations/splunk/siem/error-trend-over-time.png" />
</Frame>

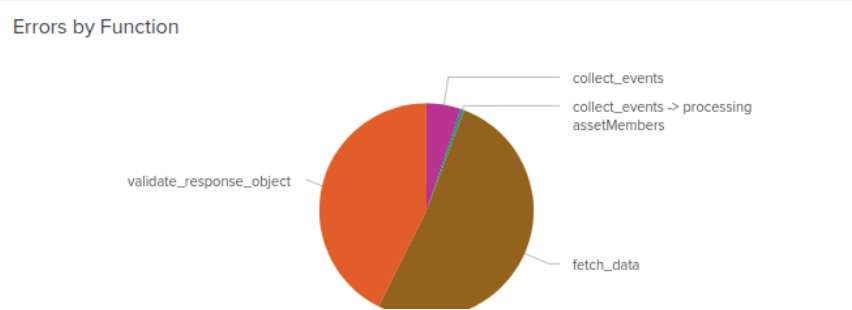
### Errors by Function

This panel shows a chart of errors (by function) generating errors in the BloodHound Enterprise Splunk app.
<Frame>
  <img src="https://mintcdn.com/specterops/1w44dPwHX0hJEUPb/images/integrations/splunk/siem/errors-by-function.png?fit=max&auto=format&n=1w44dPwHX0hJEUPb&q=85&s=1618d61758d16599634b7cf40e175031" alt="A view of the Errors by Function panel in the BloodHound Enterprise Splunk app" width="852" height="310" data-path="images/integrations/splunk/siem/errors-by-function.png" />
</Frame>

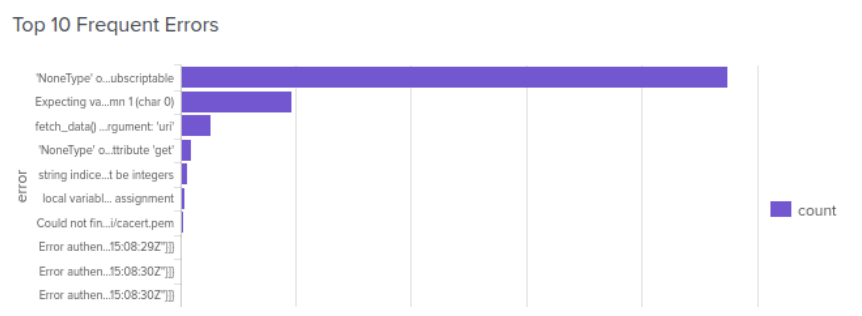
### Top 10 Frequent Errors

This panel shows a chart of the top ten most frequent error messages occurring in the BloodHound Enterprise Splunk app.
<Frame>
  <img src="https://mintcdn.com/specterops/HbCgAIdv_OAN1gyR/images/integrations/splunk/siem/top-10-frequent-errors.png?fit=max&auto=format&n=HbCgAIdv_OAN1gyR&q=85&s=d7bf7d2c43026f2b16da5bbb1a23ef5e" alt="A view of the Top 10 Frequent Errors panel in the BloodHound Enterprise Splunk app" width="862" height="316" data-path="images/integrations/splunk/siem/top-10-frequent-errors.png" />
</Frame>

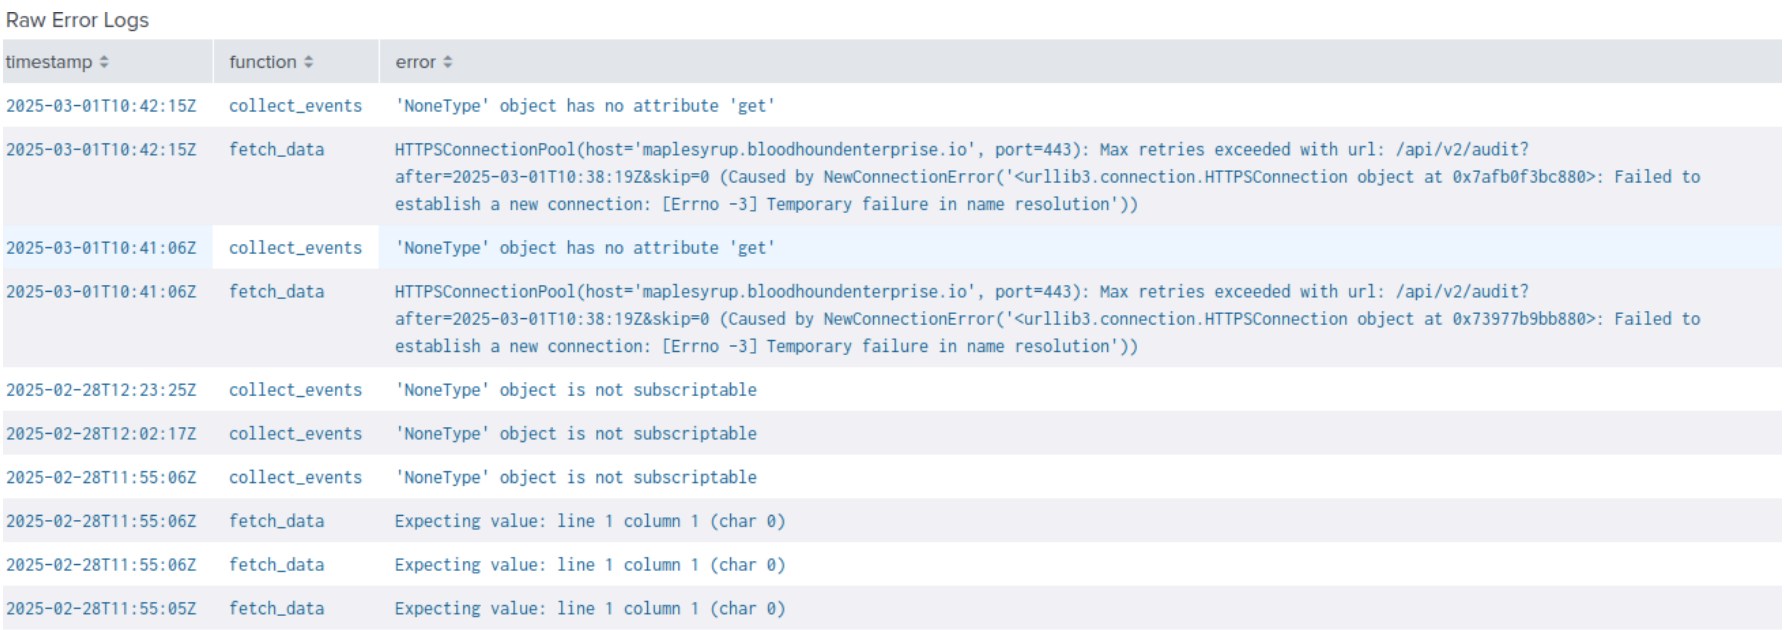
### Raw Error Logs

This panel provides a detailed table of raw error logs generated by the BloodHound Enterprise, including timestamps, function names, and error messages.
<Frame>
  <img src="https://mintcdn.com/specterops/HbCgAIdv_OAN1gyR/images/integrations/splunk/siem/raw-error-logs.png?fit=max&auto=format&n=HbCgAIdv_OAN1gyR&q=85&s=0b80ade43337acb21eac1cf9c5ebf59d" alt="A view of the Raw Error Logs panel in the BloodHound Enterprise Splunk app" width="1784" height="630" data-path="images/integrations/splunk/siem/raw-error-logs.png" />
</Frame>