> ## Documentation Index
> Fetch the complete documentation index at: https://bloodhound.specterops.io/llms.txt
> Use this file to discover all available pages before exploring further.
# Use Cortex XSOAR with BloodHound Enterprise
> Learn how to use Cortex XSOAR with BloodHound Enterprise to monitor and manage attack path findings.
 After you configure the integration, Cortex XSOAR begins fetching BloodHound Enterprise attack path findings as incidents. Use the sections below to monitor ingestion, view incidents, and inspect details.
See [install and configure](/integrations/cortex-xsoar/configure) for setup steps and fetch interval settings.
## Monitor ingestion and logs
You can view instance logs to confirm incidents are being fetched.
After you configure the integration, Cortex XSOAR begins fetching BloodHound Enterprise attack path findings as incidents. Use the sections below to monitor ingestion, view incidents, and inspect details.
See [install and configure](/integrations/cortex-xsoar/configure) for setup steps and fetch interval settings.
## Monitor ingestion and logs
You can view instance logs to confirm incidents are being fetched.
 ## View incidents
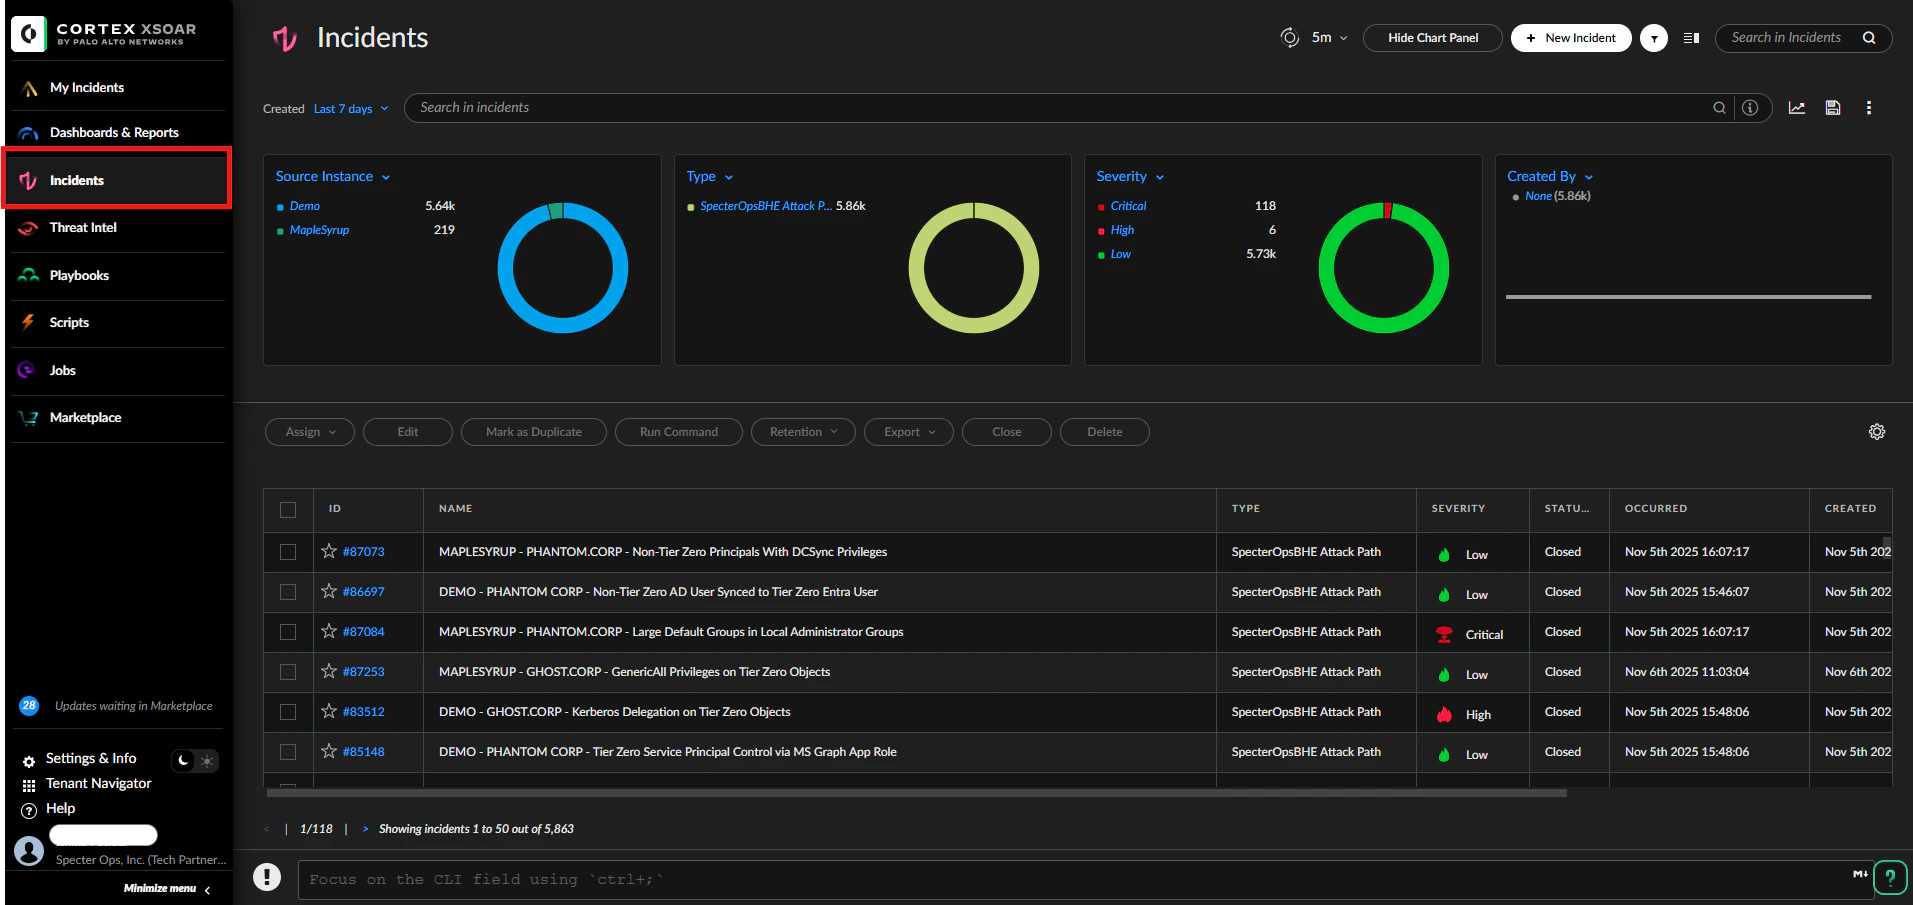
Open the **Incidents** view to see all fetched attack path incidents.
Click any incident to open its details.
## View incidents
Open the **Incidents** view to see all fetched attack path incidents.
Click any incident to open its details.
 ## Incident details
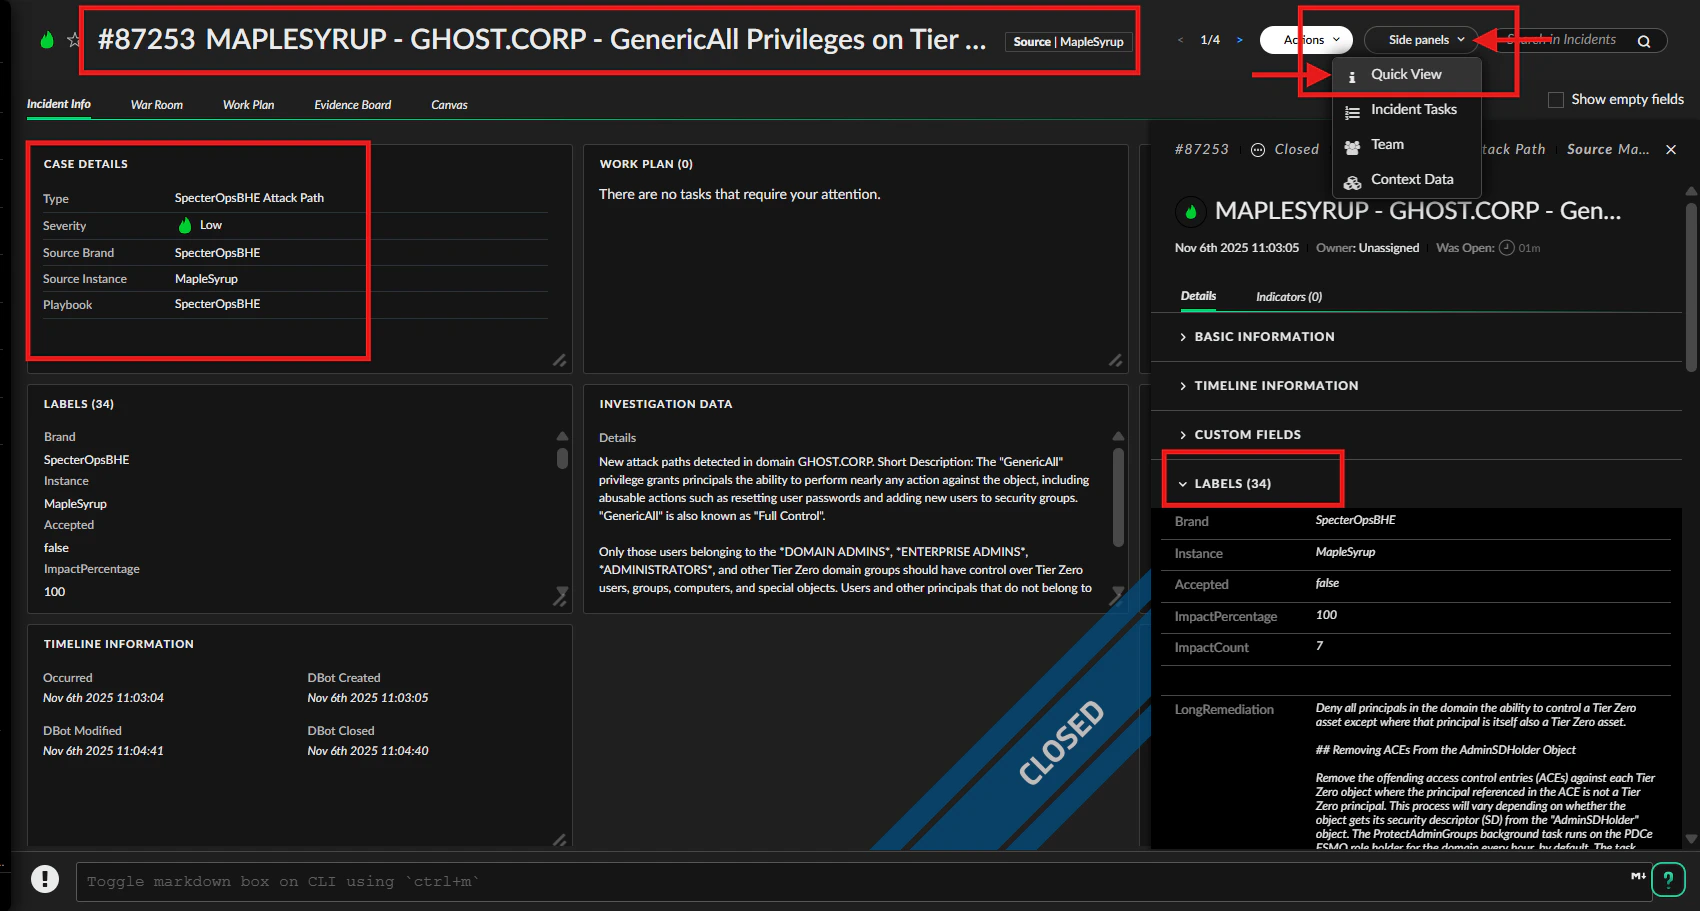
The incident details page includes key information about the attack path and related context:
* Incident name and ID
* Case details
* Quick View side panel with labels containing attack path data
## Incident details
The incident details page includes key information about the attack path and related context:
* Incident name and ID
* Case details
* Quick View side panel with labels containing attack path data
 ## Work Plan and playbook
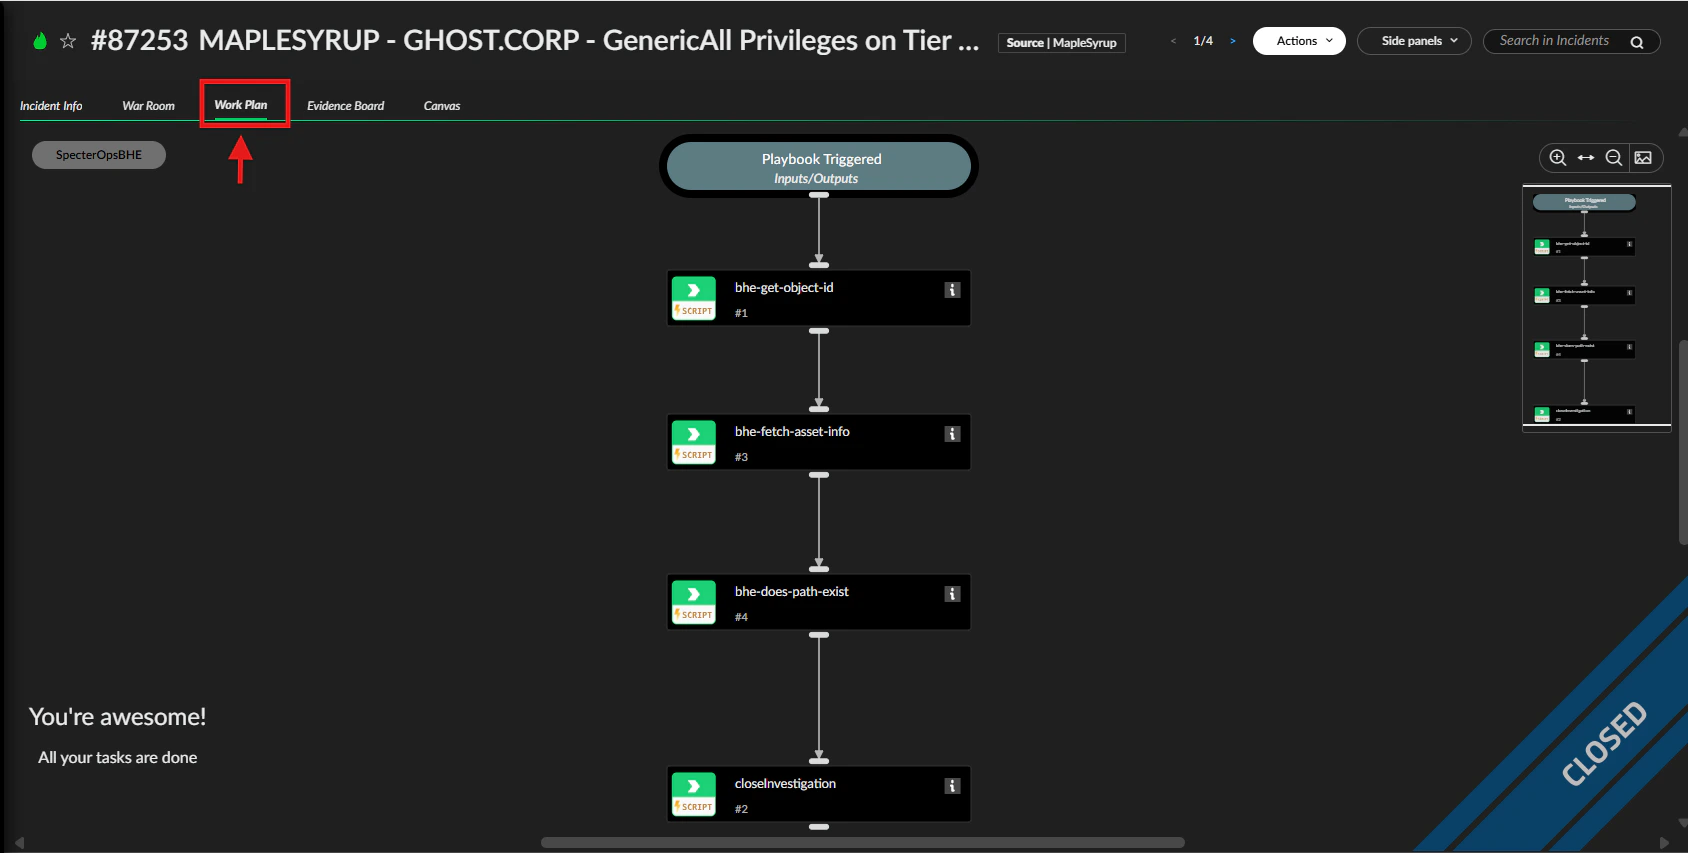
Click the **Work Plan** tab to view the playbook. The SpecterOpsBHE playbook runs custom commands to retrieve object-related information and analyze attack paths. You can click each task or script to view its results.
## Work Plan and playbook
Click the **Work Plan** tab to view the playbook. The SpecterOpsBHE playbook runs custom commands to retrieve object-related information and analyze attack paths. You can click each task or script to view its results.
 ## DBot panel
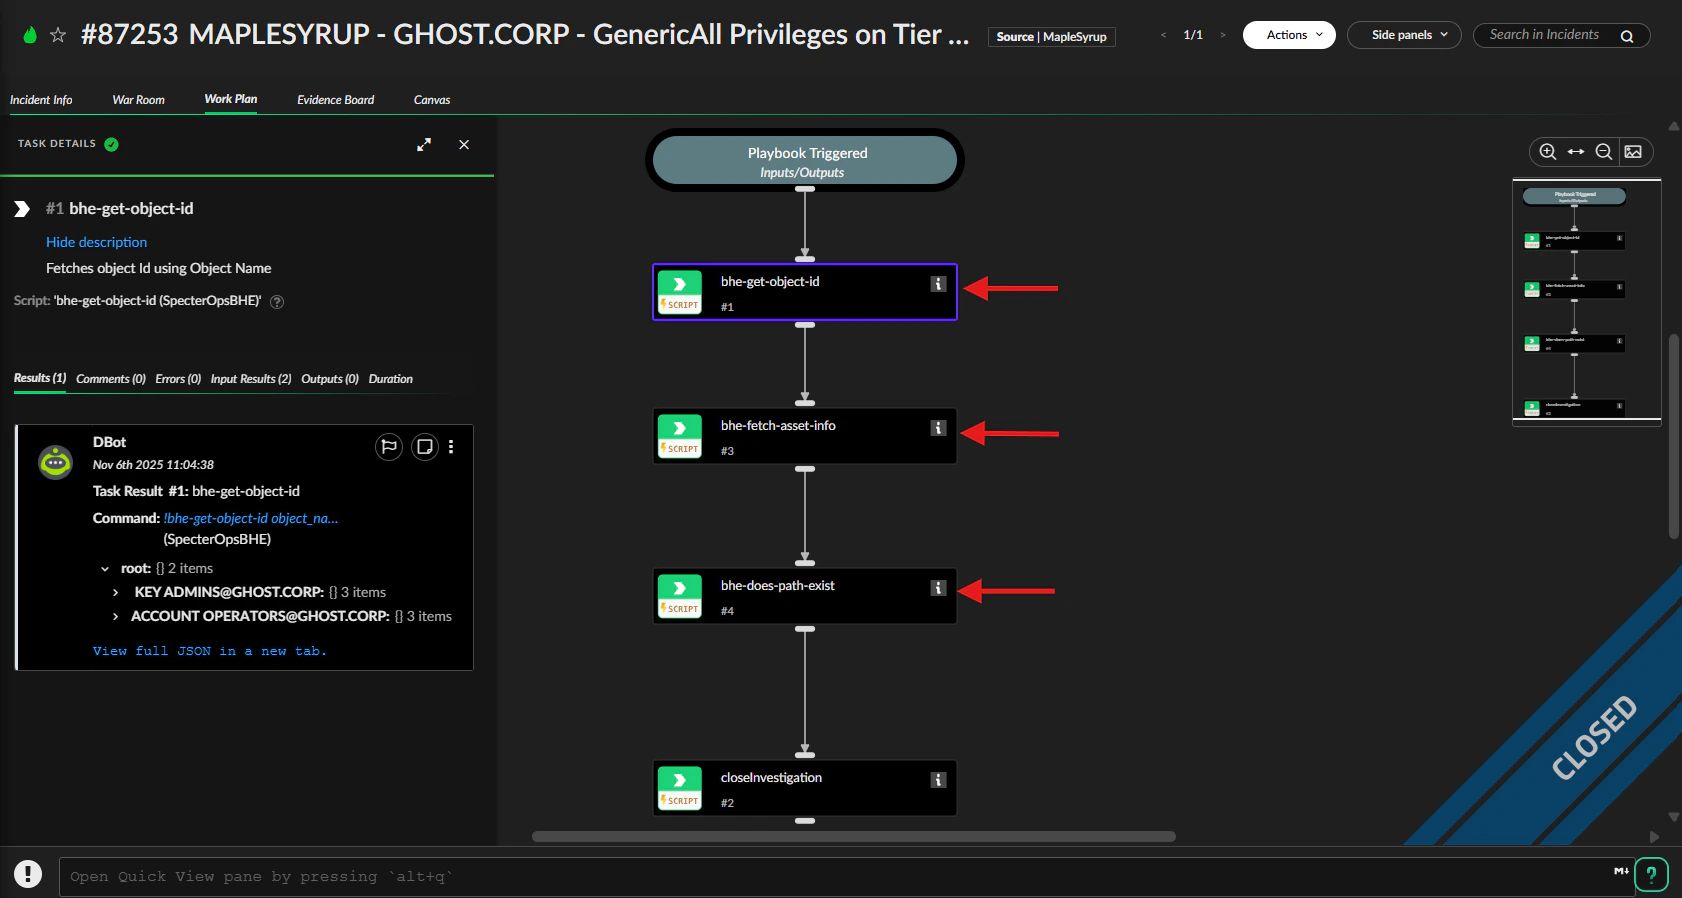
Use the DBot panel to review execution context and results. Locate the **root** section and expand it to see underlying data and command outputs related to the incident.
## DBot panel
Use the DBot panel to review execution context and results. Locate the **root** section and expand it to see underlying data and command outputs related to the incident.