> ## Documentation Index
> Fetch the complete documentation index at: https://bloodhound.specterops.io/llms.txt
> Use this file to discover all available pages before exploring further.
# Monitor Data Collection
> Learn how to interpret the status of collector jobs and file uploads.
 Monitor collection activity and processing status to confirm uploads, understand analysis timing, and troubleshoot failures. The status concepts in this guide apply to both collector client jobs on the [Finished Jobs Log](#finished-jobs-log) page and manual uploads on the [File Ingest](#file-ingest) page.
BloodHound Enterprise uses separate status indicators for tenants and jobs. These statuses operate independently and are not directly synchronized. This means you may observe scenarios where job status and tenant status appear out of sync, which is expected behavior.
* **Tenant** status reflects datapipe ingestion and analysis progress. The datapipe performs its own processing and reflects status independent of job status.
* **Job** status reflects the collector client and file ingest workflows. Jobs notify the datapipe when certain actions are complete.
## Tenant Status
Tenant status (also known as [datapipe status](/reference/datapipe/get-datapipe-status)) displays in the top-right corner of the BloodHound Enterprise user interface. This status reflects the current state of data processing for your tenant.
| Status | Description |
| ------------- | ---------------------------------------------------------------------------------------------------------------------------------------------------------------------------------------- |
| **Idle** | The tenant is waiting for new data. |
| **Ingesting** | Data is actively being ingested from one or more collection jobs or file uploads. |
| **Analyzing** | Analysis is actively running on ingested data. |
| **Pruning** | Analysis is almost complete; stale objects, edges, and disconnected nodes are being removed based on [data reconciliation](/collect-data/enterprise-collection/data-retention) settings. |
| **Purging** | Data is actively being deleted from the database (for example, you used the **Database Management** page to delete data). |
## Job Status
The following statuses apply to both the **Finished Jobs Log** and **File Ingest** pages.
| Status | Description |
| ----------------------- | -------------------------------------------------------------------------------------------------------------------------------------------------------- |
| **Ready** | Job is queued and waiting to start. |
| **Running** | Job is actively executing data collection or file processing. |
| **Complete** | Job finished successfully; all data has been ingested and analyzed. |
| **Partially Completed** | Job finished with some data processed successfully, but one or more files or operations encountered issues. Check the job details for specific warnings. |
| **Canceled** | Job was manually canceled before completion. |
| **Timed Out** | Job exceeded the maximum allowed execution time and was terminated. |
| **Failed** | Job encountered an error and could not complete. Check the job details for specific error messages. |
| **Ingesting** | Data is actively being written to the database. |
| **Analyzing** | Data collection is complete; awaiting completion of analysis. |
| **Invalid** | Data failed validation (for example, schema errors, corrupted files, or unsupported formats). |
The following state diagram illustrates the possible transitions between job statuses:
```mermaid theme={null}
stateDiagram-v2
[*] --> Ready
Ready --> Running: Job starts
Running --> Ingesting: Data upload begins
Running --> Failed: Error occurs
Running --> TimedOut: Timeout exceeded
Running --> Canceled: User cancels
Ingesting --> Analyzing: Ingestion complete
Ingesting --> Invalid: Validation fails
Analyzing --> Complete: Analysis complete
Analyzing --> PartiallyCompleted: Partial success
state "Timed Out" as TimedOut
state "Partially Completed" as PartiallyCompleted
Complete
Failed
Canceled
Invalid
```
## Finished Jobs Log
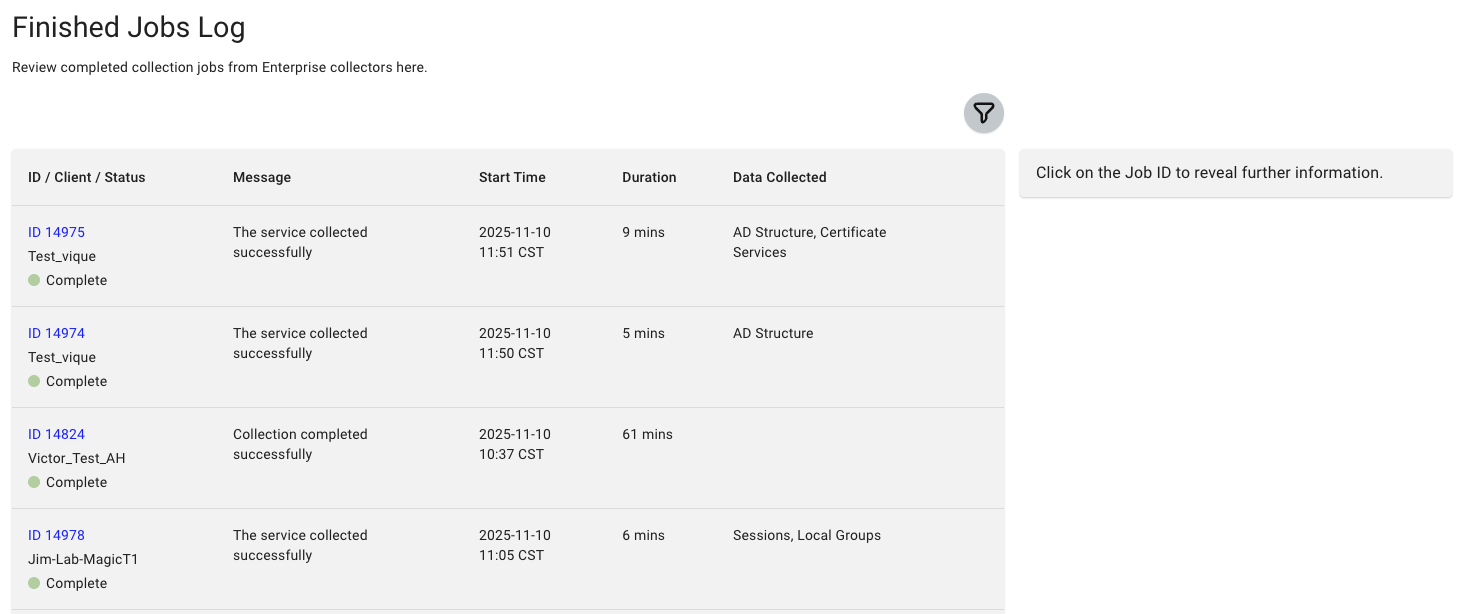
Data collection clients log completed jobs to the **Finished Jobs Log**, which provides details about all collection activities that a client performs. This log is essential for monitoring and troubleshooting data collection jobs.
The **Finished Jobs Log** page provides a detailed log of each collection job, including:
| Field | Value |
| ------------------ | ---------------------------------------------------------------------------------------------------------------------------------------------------------------------------------------------------------------------------- |
| **ID** | A unique identifier for the client collection job |
| **Client** | The client that initiated the collection job |
| **Status** | The [status](#job-status) of the collection job (for example, complete, failed) |
| **Message** | A brief message providing additional context about the collection job |
| **Start Time** | The time when the collection job started |
| **Duration** | The time taken to process the collection job |
| **Data Collected** | The type of data that the client is configured to collect, see [SharpHound Data and Permissions](/collect-data/sharphound-data-permissions) and [AzureHound Data and Permissions](/collect-data/azurehound-data-permissions) |
For clients on [scheduled collection](/collect-data/enterprise-collection/collection-schedule), jobs can display an *Analyzing* status while the tenant status remains *Idle*. When the scheduled collection time arrives, the tenant status changes to *Ingesting*, and analysis begins automatically after the collection completes successfully.
Monitor collection activity and processing status to confirm uploads, understand analysis timing, and troubleshoot failures. The status concepts in this guide apply to both collector client jobs on the [Finished Jobs Log](#finished-jobs-log) page and manual uploads on the [File Ingest](#file-ingest) page.
BloodHound Enterprise uses separate status indicators for tenants and jobs. These statuses operate independently and are not directly synchronized. This means you may observe scenarios where job status and tenant status appear out of sync, which is expected behavior.
* **Tenant** status reflects datapipe ingestion and analysis progress. The datapipe performs its own processing and reflects status independent of job status.
* **Job** status reflects the collector client and file ingest workflows. Jobs notify the datapipe when certain actions are complete.
## Tenant Status
Tenant status (also known as [datapipe status](/reference/datapipe/get-datapipe-status)) displays in the top-right corner of the BloodHound Enterprise user interface. This status reflects the current state of data processing for your tenant.
| Status | Description |
| ------------- | ---------------------------------------------------------------------------------------------------------------------------------------------------------------------------------------- |
| **Idle** | The tenant is waiting for new data. |
| **Ingesting** | Data is actively being ingested from one or more collection jobs or file uploads. |
| **Analyzing** | Analysis is actively running on ingested data. |
| **Pruning** | Analysis is almost complete; stale objects, edges, and disconnected nodes are being removed based on [data reconciliation](/collect-data/enterprise-collection/data-retention) settings. |
| **Purging** | Data is actively being deleted from the database (for example, you used the **Database Management** page to delete data). |
## Job Status
The following statuses apply to both the **Finished Jobs Log** and **File Ingest** pages.
| Status | Description |
| ----------------------- | -------------------------------------------------------------------------------------------------------------------------------------------------------- |
| **Ready** | Job is queued and waiting to start. |
| **Running** | Job is actively executing data collection or file processing. |
| **Complete** | Job finished successfully; all data has been ingested and analyzed. |
| **Partially Completed** | Job finished with some data processed successfully, but one or more files or operations encountered issues. Check the job details for specific warnings. |
| **Canceled** | Job was manually canceled before completion. |
| **Timed Out** | Job exceeded the maximum allowed execution time and was terminated. |
| **Failed** | Job encountered an error and could not complete. Check the job details for specific error messages. |
| **Ingesting** | Data is actively being written to the database. |
| **Analyzing** | Data collection is complete; awaiting completion of analysis. |
| **Invalid** | Data failed validation (for example, schema errors, corrupted files, or unsupported formats). |
The following state diagram illustrates the possible transitions between job statuses:
```mermaid theme={null}
stateDiagram-v2
[*] --> Ready
Ready --> Running: Job starts
Running --> Ingesting: Data upload begins
Running --> Failed: Error occurs
Running --> TimedOut: Timeout exceeded
Running --> Canceled: User cancels
Ingesting --> Analyzing: Ingestion complete
Ingesting --> Invalid: Validation fails
Analyzing --> Complete: Analysis complete
Analyzing --> PartiallyCompleted: Partial success
state "Timed Out" as TimedOut
state "Partially Completed" as PartiallyCompleted
Complete
Failed
Canceled
Invalid
```
## Finished Jobs Log
Data collection clients log completed jobs to the **Finished Jobs Log**, which provides details about all collection activities that a client performs. This log is essential for monitoring and troubleshooting data collection jobs.
The **Finished Jobs Log** page provides a detailed log of each collection job, including:
| Field | Value |
| ------------------ | ---------------------------------------------------------------------------------------------------------------------------------------------------------------------------------------------------------------------------- |
| **ID** | A unique identifier for the client collection job |
| **Client** | The client that initiated the collection job |
| **Status** | The [status](#job-status) of the collection job (for example, complete, failed) |
| **Message** | A brief message providing additional context about the collection job |
| **Start Time** | The time when the collection job started |
| **Duration** | The time taken to process the collection job |
| **Data Collected** | The type of data that the client is configured to collect, see [SharpHound Data and Permissions](/collect-data/sharphound-data-permissions) and [AzureHound Data and Permissions](/collect-data/azurehound-data-permissions) |
For clients on [scheduled collection](/collect-data/enterprise-collection/collection-schedule), jobs can display an *Analyzing* status while the tenant status remains *Idle*. When the scheduled collection time arrives, the tenant status changes to *Ingesting*, and analysis begins automatically after the collection completes successfully.
 In the left menu, click **Administration** > **Finished Jobs Log**.
Click the specific job **ID** in the table to open the **Details** panel.
You can also click the icon to filter job IDs by status, data collected, data range, and client.
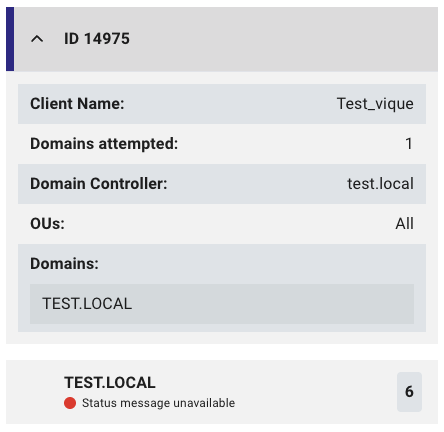
In the **Details** panel, review the job details for the selected ID. Look for any errors or warnings that may indicate issues during the collection process.
The **Details** panel displays the following information for each job ID:
| Field | Description |
| --------------------- | ------------------------------------------------------------------------------------------------------------------------------ |
| **Job ID** | A unique identifier for the client collection operation |
| **Client Name** | The name of the client that performed the collection |
| **Domains attempted** | The number of domains that were attempted to be collected |
| **Domain Controller** | The domain controller used for collection |
| **OUs** | The organizational units (OUs) that were collected |
| **Domains** | The domains that were collected, including the number of objects collected from each domain and status messages (if available) |
In the left menu, click **Administration** > **Finished Jobs Log**.
Click the specific job **ID** in the table to open the **Details** panel.
You can also click the icon to filter job IDs by status, data collected, data range, and client.
In the **Details** panel, review the job details for the selected ID. Look for any errors or warnings that may indicate issues during the collection process.
The **Details** panel displays the following information for each job ID:
| Field | Description |
| --------------------- | ------------------------------------------------------------------------------------------------------------------------------ |
| **Job ID** | A unique identifier for the client collection operation |
| **Client Name** | The name of the client that performed the collection |
| **Domains attempted** | The number of domains that were attempted to be collected |
| **Domain Controller** | The domain controller used for collection |
| **OUs** | The organizational units (OUs) that were collected |
| **Domains** | The domains that were collected, including the number of objects collected from each domain and status messages (if available) |
 ## File Ingest
When you perform an [ad-hoc data collection](/collect-data/enterprise-collection/ad-hoc-collection) by uploading a SharpHound output .zip file, ingestion process details are logged on the **File Ingest** page.
You can use this page to monitor ingestion and ensure successful data processing. It shows the status of each file ingest operation, which can be helpful for viewing data upload history or troubleshooting data ingestion issues.
The **File Ingest** page provides a detailed log of each ingestion attempt, including:
| Field | Description |
| -------------------- | ---------------------------------------------------------------------------------------------- |
| **ID** | A unique identifier for the file ingest operation |
| **User** | The user who initiated the file ingest operation |
| **Status** | The current [status](#job-status) of the file ingest operation (for example, complete, failed) |
| **Message** | A brief message providing additional context about the file ingest operation |
| **Start Time** | The time when the file ingest was initiated |
| **Duration** | The time taken to process the file ingest operation |
| **File Information** | Details about the ingested file(s), such as file count and file name(s) |
In the left menu, click **Administration** > **File Ingest**.
Click the specific file ingest **ID** in the table to open the **Details** panel.
You can also click the icon to filter ingest IDs by status, data range, and user.
## File Ingest
When you perform an [ad-hoc data collection](/collect-data/enterprise-collection/ad-hoc-collection) by uploading a SharpHound output .zip file, ingestion process details are logged on the **File Ingest** page.
You can use this page to monitor ingestion and ensure successful data processing. It shows the status of each file ingest operation, which can be helpful for viewing data upload history or troubleshooting data ingestion issues.
The **File Ingest** page provides a detailed log of each ingestion attempt, including:
| Field | Description |
| -------------------- | ---------------------------------------------------------------------------------------------- |
| **ID** | A unique identifier for the file ingest operation |
| **User** | The user who initiated the file ingest operation |
| **Status** | The current [status](#job-status) of the file ingest operation (for example, complete, failed) |
| **Message** | A brief message providing additional context about the file ingest operation |
| **Start Time** | The time when the file ingest was initiated |
| **Duration** | The time taken to process the file ingest operation |
| **File Information** | Details about the ingested file(s), such as file count and file name(s) |
In the left menu, click **Administration** > **File Ingest**.
Click the specific file ingest **ID** in the table to open the **Details** panel.
You can also click the icon to filter ingest IDs by status, data range, and user.
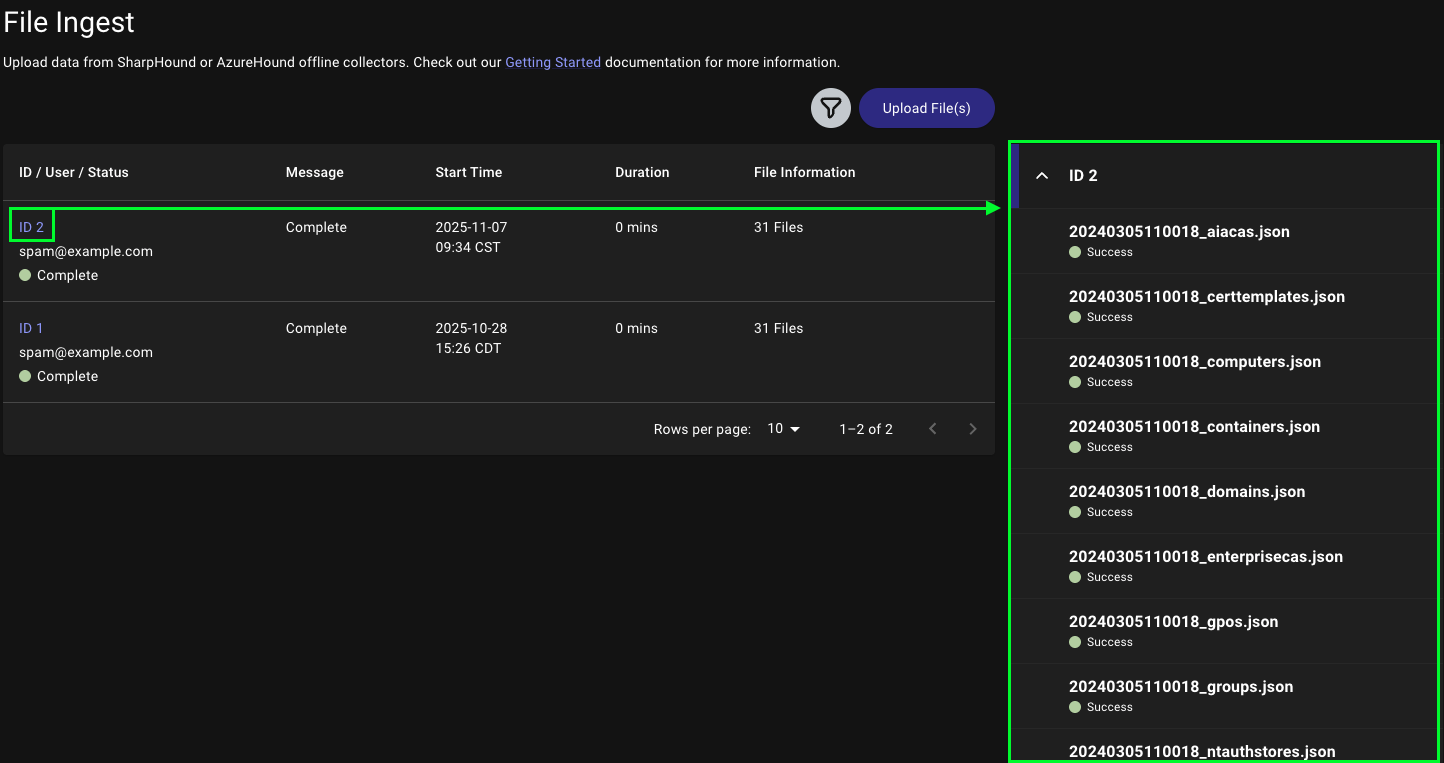 In the **Details** panel, review the log entries for the selected ID. Look for any errors or warnings that may indicate issues during the ingestion process.
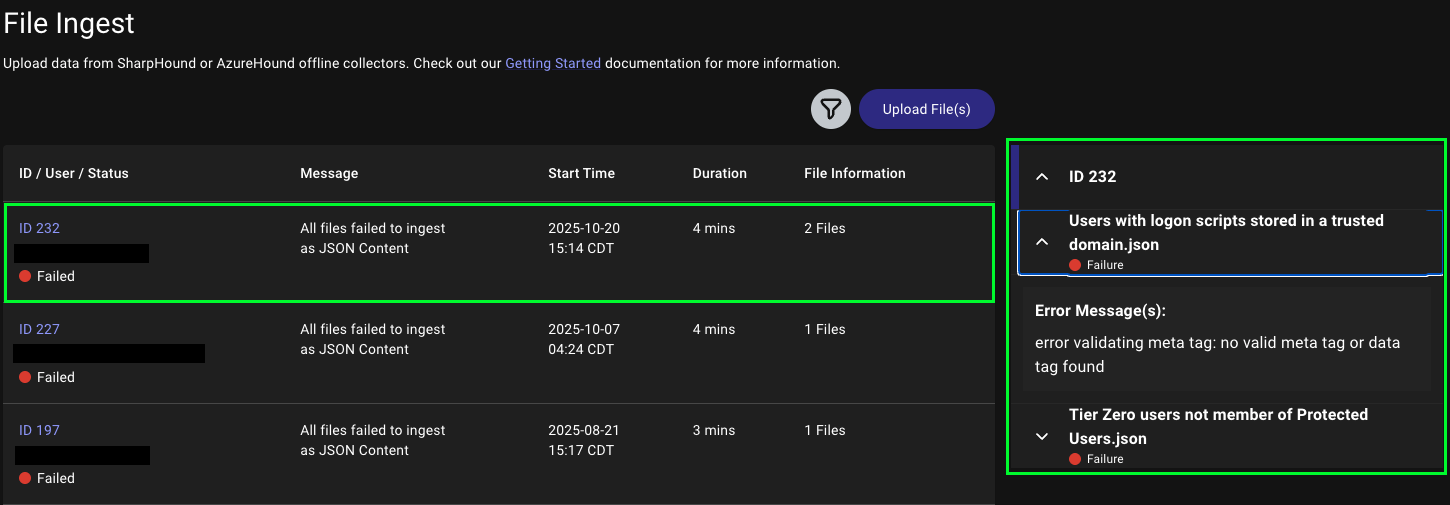
If a file failed to ingest due to format issues or data corruption, the log provides specific error messages to help you diagnose the problem.
For example, the following log indicates a failed ingestion due to a schema validation error:
In the **Details** panel, review the log entries for the selected ID. Look for any errors or warnings that may indicate issues during the ingestion process.
If a file failed to ingest due to format issues or data corruption, the log provides specific error messages to help you diagnose the problem.
For example, the following log indicates a failed ingestion due to a schema validation error: