> ## Documentation Index
> Fetch the complete documentation index at: https://bloodhound.specterops.io/llms.txt
> Use this file to discover all available pages before exploring further.
# Posture
> Learn how to use the Posture page to track your organization's risk posture over time and measure the impact of your remediation efforts.
 While the [Attack Paths](/analyze-data/findings/attack-paths) page helps you investigate and remediate specific findings related to Attack Paths, the **Posture** page provides a high-level view of your organization's security posture over time.
It aggregates Attack Path data to provide insights about where the biggest risks originate and how your remediation efforts are reducing risk.
While the [Attack Paths](/analyze-data/findings/attack-paths) page helps you investigate and remediate specific findings related to Attack Paths, the **Posture** page provides a high-level view of your organization's security posture over time.
It aggregates Attack Path data to provide insights about where the biggest risks originate and how your remediation efforts are reducing risk.
 ## Filters
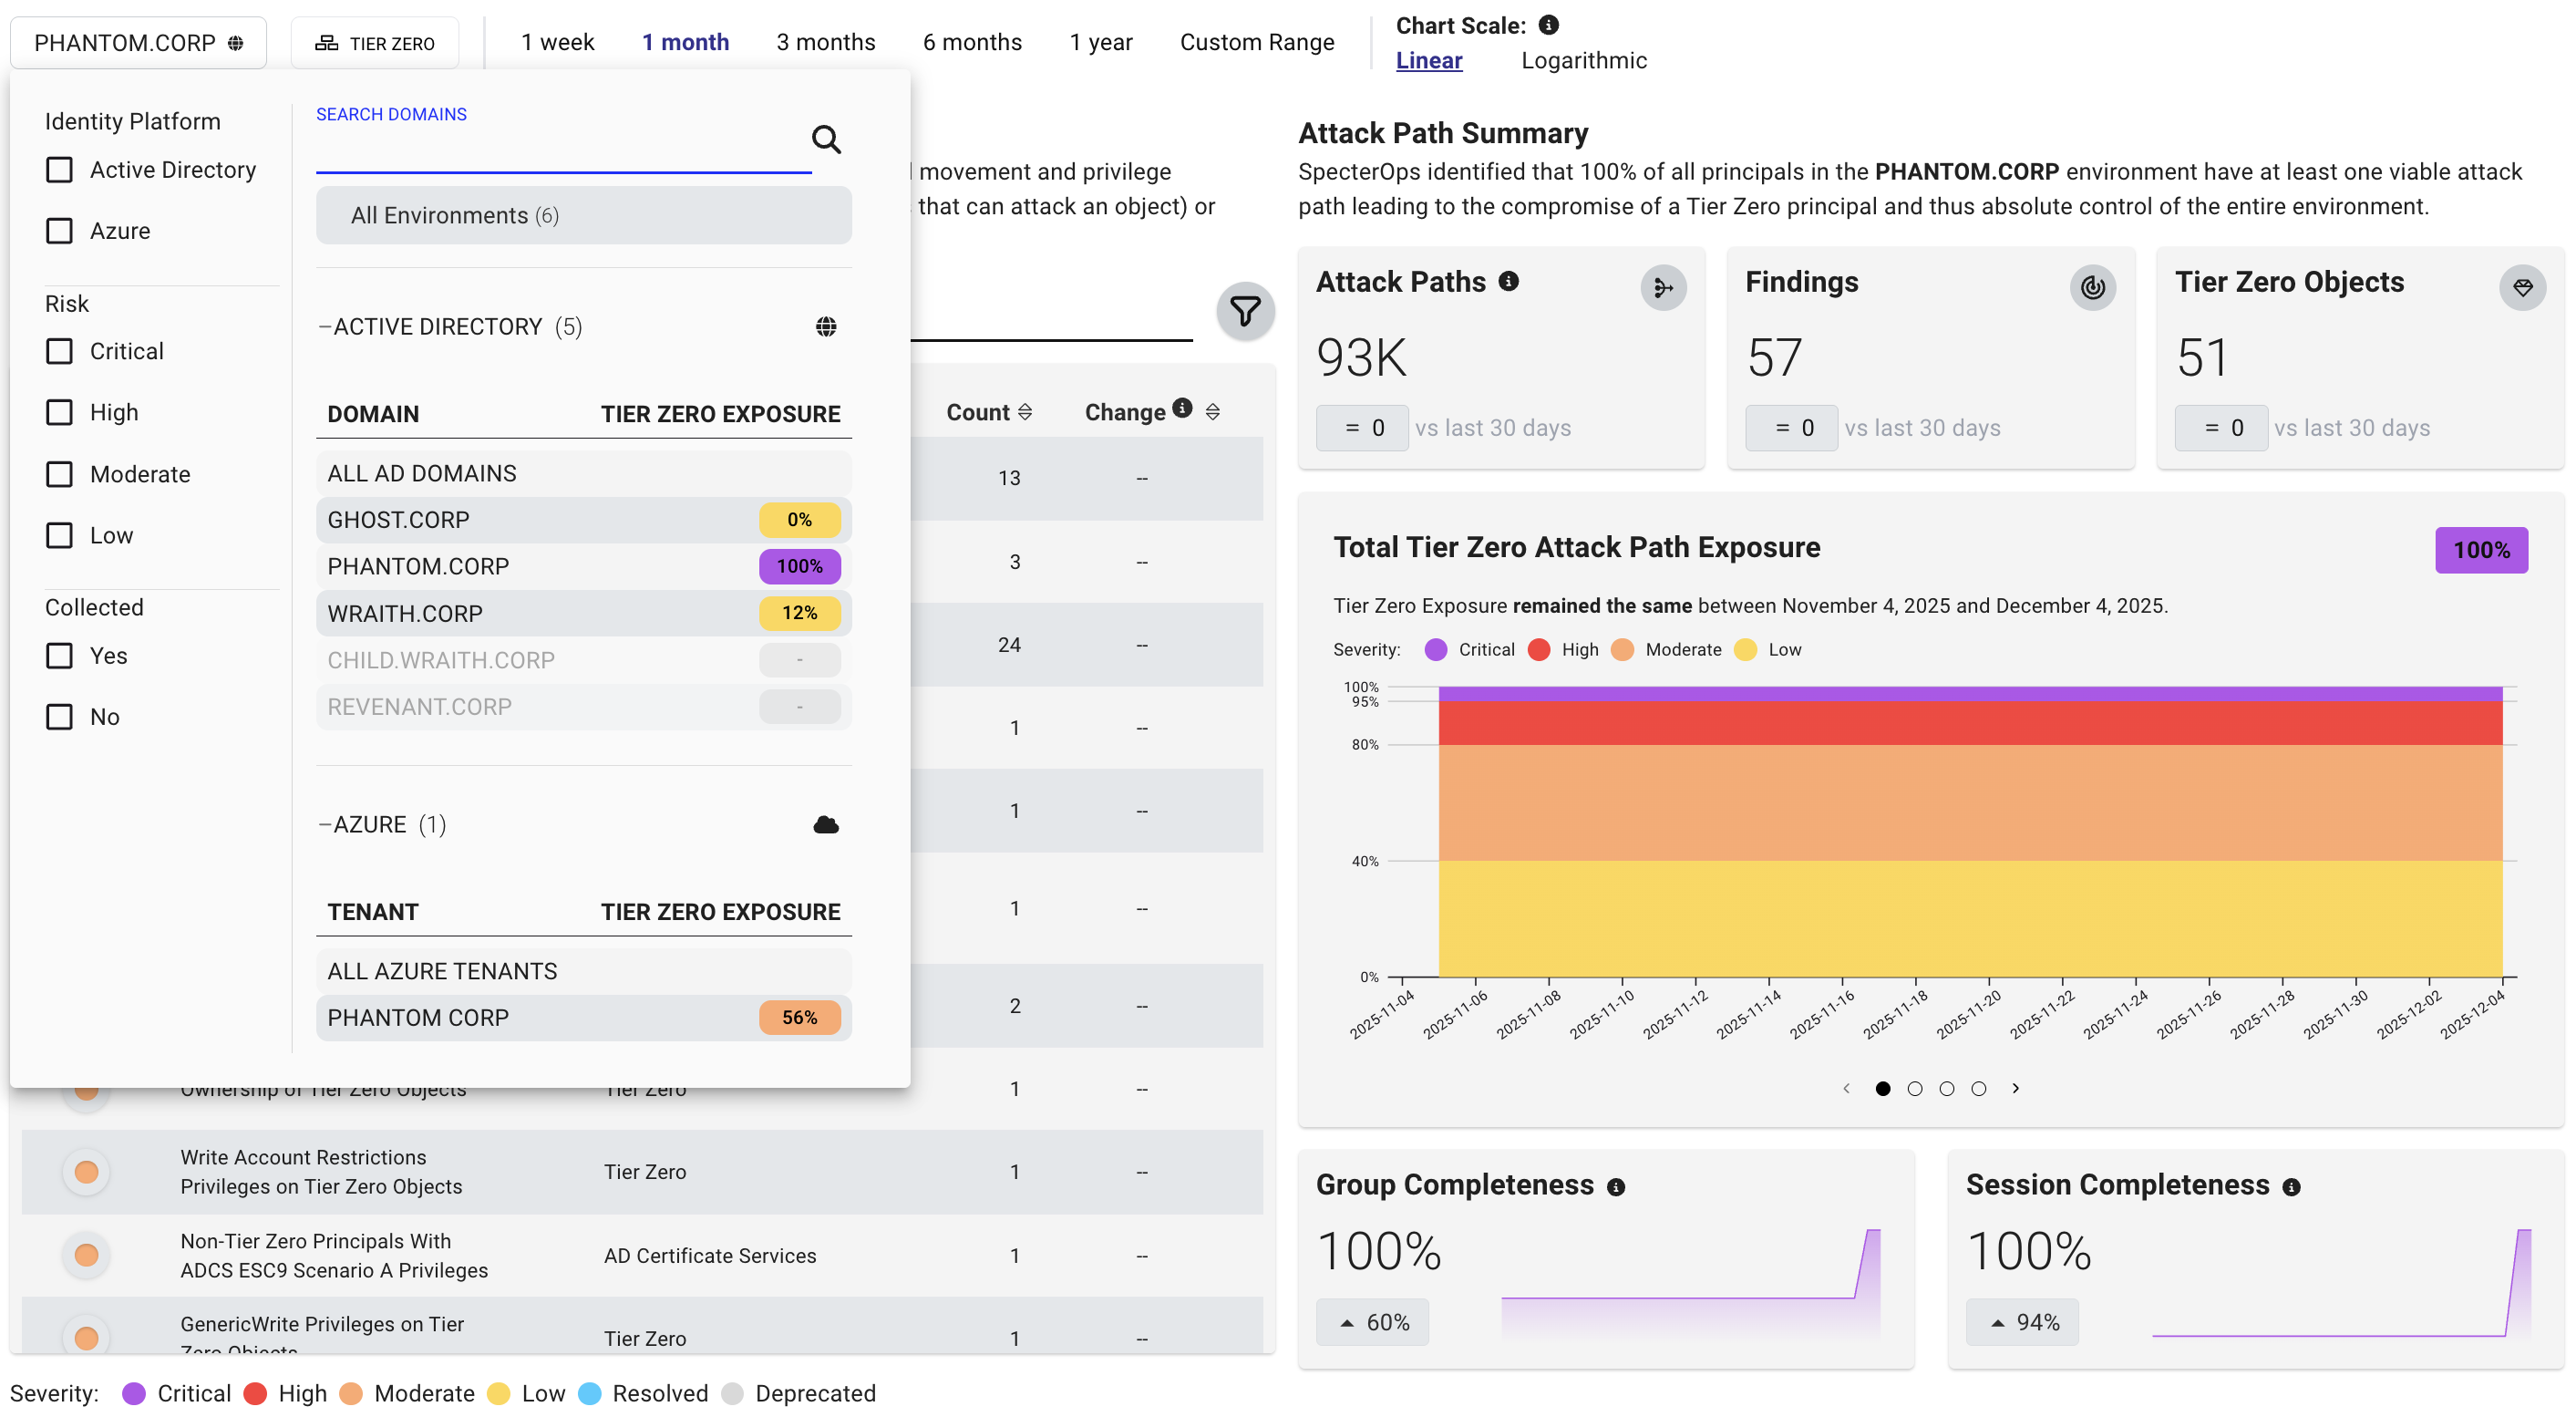
The **Posture** page includes filters to help you focus on specific environments and zones. You can use these filters to view and track trends over time.
### Environment
The environment filter allows you to view posture trends for a specific platform, such as an Active Directory domain or Azure tenant.
This can help you understand how posture is changing within that environment and identify areas that may require additional attention.
You can also filter on severity levels to focus on trends in high-risk Attack Paths. For example, you can filter to show only **CRITICAL** Attack Paths to see how the most severe risks are changing over time.
### Zone
The zone filter allows you to view posture trends for a specific privilege zone. By default, Tier Zero is selected, but you can choose to view findings for other zones.
You can also use the zone filter to focus on findings by the Hygiene category.
### Date range
The date range filter allows you to compare posture trends between analysis runs. For example, you can compare the current state of your environment to a previous point in time to see how your risk posture has changed.
Choose from preset ranges or set a custom range to compare specific analysis runs. Custom date ranges include a time picker, so you can set exact start and end times.
For meaningful trend comparisons, use the same filter scope and similar date ranges across reviews. Custom date ranges include a time picker, so you can set exact start and end times.
### Chart scale
The chart scale filter allows you to adjust the scale of the posture graphs to better visualize trends. For example, if you have a large number of findings, you may want to use a logarithmic scale to better see changes over time.
The linear scale shows consistent ranges clearly, while the logarithmic scale highlights outliers and wide variations in the data.
## Interpreting Posture
The **Posture** page tracks how your risk posture changes between analysis runs. It includes several sections that show trends in attack path severity, findings, and exposure over time.
When reviewing posture trends, consider the following:
* Attack Paths—Each attack path is made up of one or more relationships.
* Findings—Each finding can be composed of one or more attack paths, so finding counts and Attack Path counts can differ.
## Attack Paths
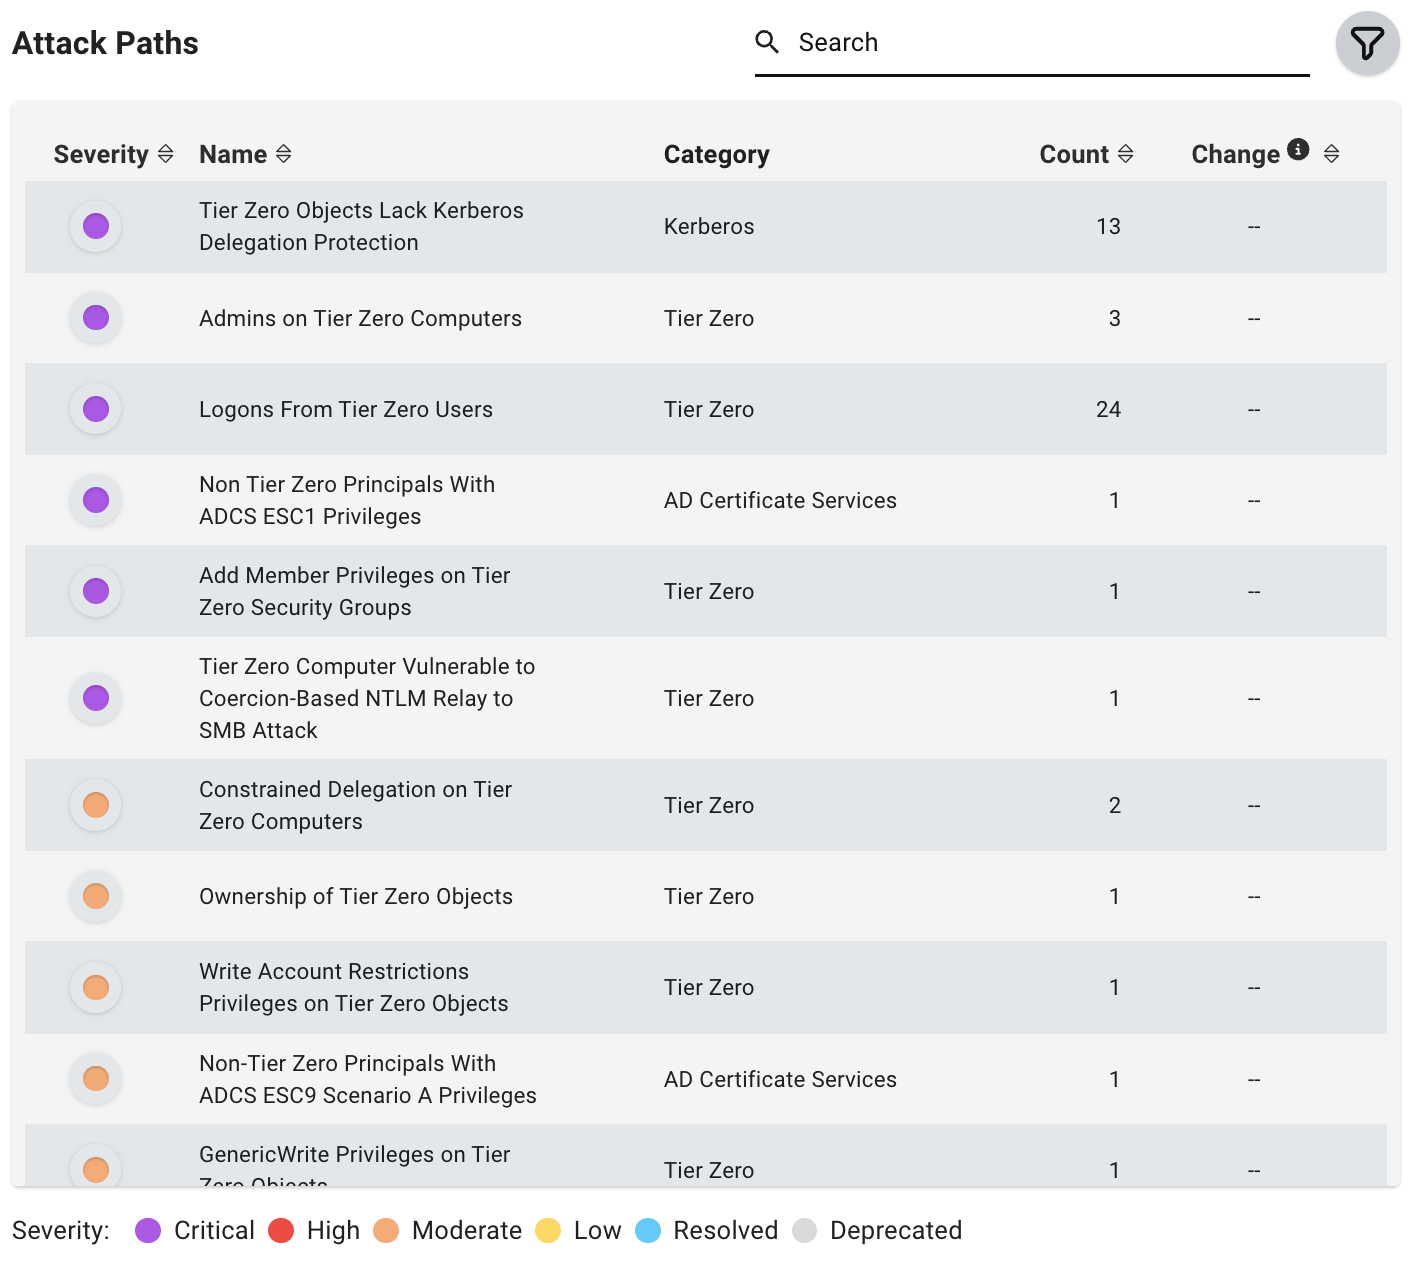
The **Attack Paths** table shows attack paths with active findings in the selected date range. This list can also include attack paths that were fully resolved (by your remediation efforts) or deprecated (by SpecterOps) during the same range.
This table is designed for trend tracking and reporting. For per-finding details such as description, impacted principals, exposure/impact metrics, and remediation guidance, use the [Attack Paths](/analyze-data/findings/attack-paths) page.
| Column | Description |
| ------------ | ------------------------------------------------------------------------------------------------------------------ |
| **Severity** | The severity level of the Attack Path at the end date of the selected range. |
| **Name** | The name of the Attack Path. |
| **Category** | The category of the Attack Path. |
| **Count** | The number of findings that existed on the end date of the selected range. |
| **Change** | The calculated difference in the number of findings between the beginning and end date of the selected time range. |
Count is calculated on a per-day basis. Depending on the selected date and time range, displayed counts may differ if analysis runs span day boundaries.
## Filters
The **Posture** page includes filters to help you focus on specific environments and zones. You can use these filters to view and track trends over time.
### Environment
The environment filter allows you to view posture trends for a specific platform, such as an Active Directory domain or Azure tenant.
This can help you understand how posture is changing within that environment and identify areas that may require additional attention.
You can also filter on severity levels to focus on trends in high-risk Attack Paths. For example, you can filter to show only **CRITICAL** Attack Paths to see how the most severe risks are changing over time.
### Zone
The zone filter allows you to view posture trends for a specific privilege zone. By default, Tier Zero is selected, but you can choose to view findings for other zones.
You can also use the zone filter to focus on findings by the Hygiene category.
### Date range
The date range filter allows you to compare posture trends between analysis runs. For example, you can compare the current state of your environment to a previous point in time to see how your risk posture has changed.
Choose from preset ranges or set a custom range to compare specific analysis runs. Custom date ranges include a time picker, so you can set exact start and end times.
For meaningful trend comparisons, use the same filter scope and similar date ranges across reviews. Custom date ranges include a time picker, so you can set exact start and end times.
### Chart scale
The chart scale filter allows you to adjust the scale of the posture graphs to better visualize trends. For example, if you have a large number of findings, you may want to use a logarithmic scale to better see changes over time.
The linear scale shows consistent ranges clearly, while the logarithmic scale highlights outliers and wide variations in the data.
## Interpreting Posture
The **Posture** page tracks how your risk posture changes between analysis runs. It includes several sections that show trends in attack path severity, findings, and exposure over time.
When reviewing posture trends, consider the following:
* Attack Paths—Each attack path is made up of one or more relationships.
* Findings—Each finding can be composed of one or more attack paths, so finding counts and Attack Path counts can differ.
## Attack Paths
The **Attack Paths** table shows attack paths with active findings in the selected date range. This list can also include attack paths that were fully resolved (by your remediation efforts) or deprecated (by SpecterOps) during the same range.
This table is designed for trend tracking and reporting. For per-finding details such as description, impacted principals, exposure/impact metrics, and remediation guidance, use the [Attack Paths](/analyze-data/findings/attack-paths) page.
| Column | Description |
| ------------ | ------------------------------------------------------------------------------------------------------------------ |
| **Severity** | The severity level of the Attack Path at the end date of the selected range. |
| **Name** | The name of the Attack Path. |
| **Category** | The category of the Attack Path. |
| **Count** | The number of findings that existed on the end date of the selected range. |
| **Change** | The calculated difference in the number of findings between the beginning and end date of the selected time range. |
Count is calculated on a per-day basis. Depending on the selected date and time range, displayed counts may differ if analysis runs span day boundaries.
 BloodHound Enterprise calculates severity from the percentage of users and computers that can abuse the Attack Path. For example, a **CRITICAL** Attack Path is abusable by 95% to 100% of all users and computers in the environment.
The severity levels map to the following exposure percentages:
* **CRITICAL**: 95%-100%
* **HIGH**: 80%-94%
* **MODERATE**: 40%-79%
* **LOW**: 0%-39%
These are expressed with colors in the Severity column.
BloodHound Enterprise calculates severity from the percentage of users and computers that can abuse the Attack Path. For example, a **CRITICAL** Attack Path is abusable by 95% to 100% of all users and computers in the environment.
The severity levels map to the following exposure percentages:
* **CRITICAL**: 95%-100%
* **HIGH**: 80%-94%
* **MODERATE**: 40%-79%
* **LOW**: 0%-39%
These are expressed with colors in the Severity column.
 ## Attack Path Summary
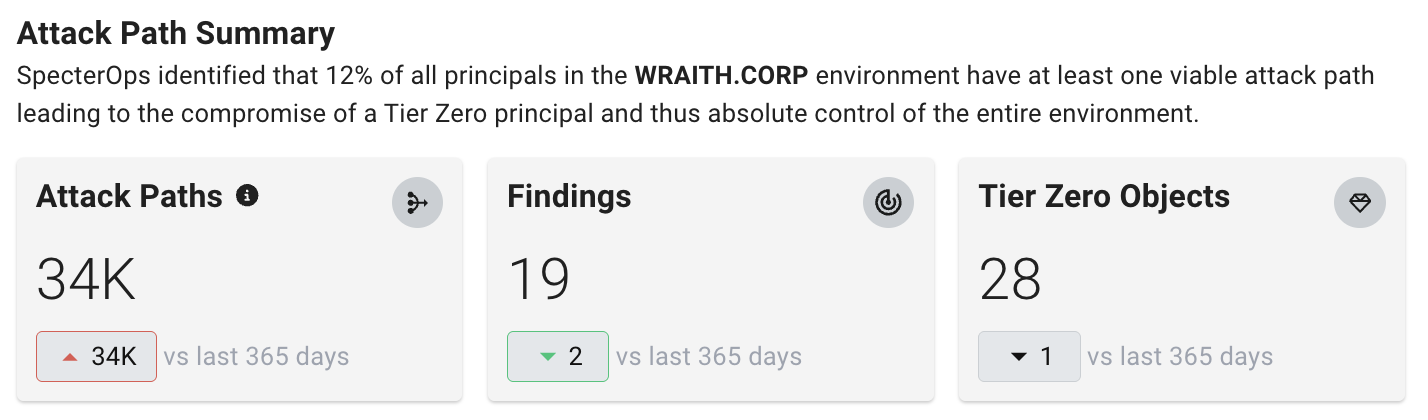
This section provides a summary of risk within the applied filter on the selected end date, including the change in Attack Paths, findings, and Tier Zero objects within the selected time frame.
## Attack Path Summary
This section provides a summary of risk within the applied filter on the selected end date, including the change in Attack Paths, findings, and Tier Zero objects within the selected time frame.
 ## Posture Over Time Graphs
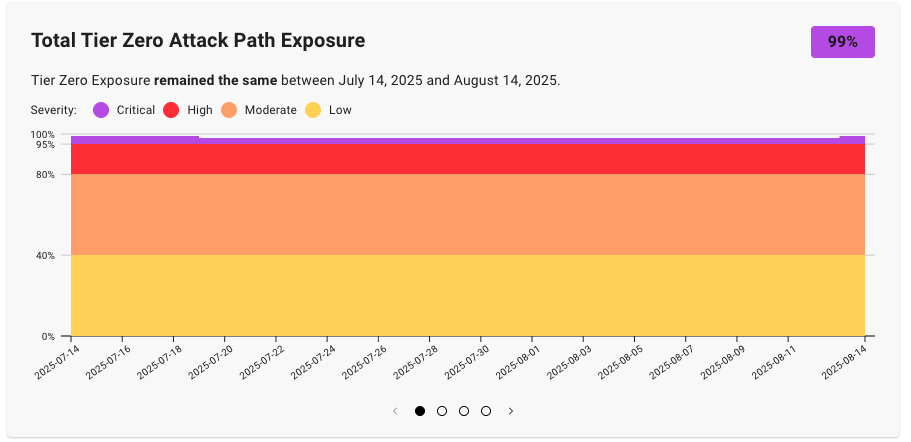
This series of visualizations shows posture over time based on the selected filter parameters. They provide insights about trends in exposure levels, findings, attack paths, and privilege zone objects.
* **Attack Path Exposure** - This graph represents the trend (by percentage) of principals within the environment (and trusted or connected environments) that can compromise the selected zone.
## Posture Over Time Graphs
This series of visualizations shows posture over time based on the selected filter parameters. They provide insights about trends in exposure levels, findings, attack paths, and privilege zone objects.
* **Attack Path Exposure** - This graph represents the trend (by percentage) of principals within the environment (and trusted or connected environments) that can compromise the selected zone.
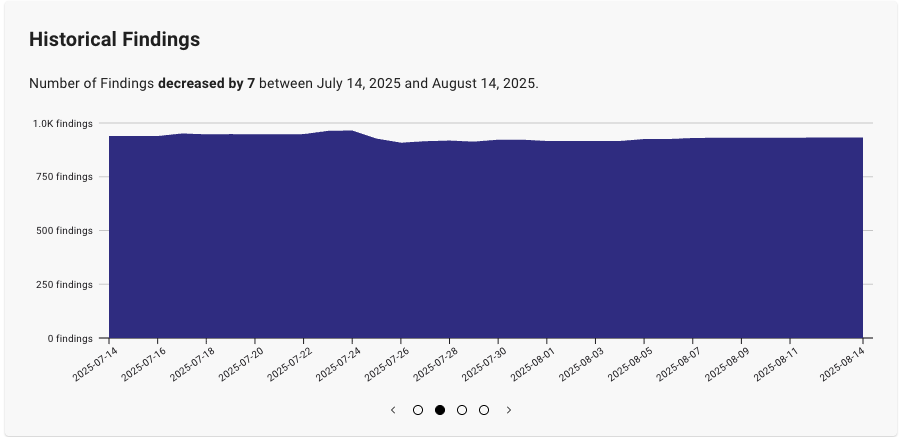
 * **Historical Findings** - This graph represents the trend (by count) in the total number of findings within the selected filter parameters.
As you remediate findings (or newly created misconfigurations generate new ones), this chart helps you track the changes in the number of identified findings over time.
* **Historical Findings** - This graph represents the trend (by count) in the total number of findings within the selected filter parameters.
As you remediate findings (or newly created misconfigurations generate new ones), this chart helps you track the changes in the number of identified findings over time.
 * **Total Attack Paths** - This graph represents the trend (by count) in the total number of active Attack Paths within the selected filter parameters.
As you remediate findings that contribute to Attack Paths (or newly created misconfigurations generate new ones), this chart helps you track the changes in the total number of identified Attack Paths over time.
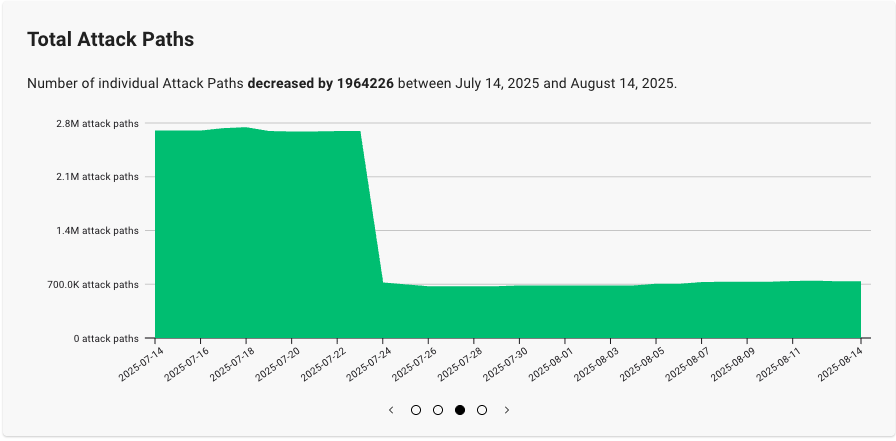
* **Total Attack Paths** - This graph represents the trend (by count) in the total number of active Attack Paths within the selected filter parameters.
As you remediate findings that contribute to Attack Paths (or newly created misconfigurations generate new ones), this chart helps you track the changes in the total number of identified Attack Paths over time.
 * **Objects** - This graph represents the trend in the total number of objects in the selected zone.
As you add or remove objects from the selected zone, this chart helps you track the changes in the number of objects over time.
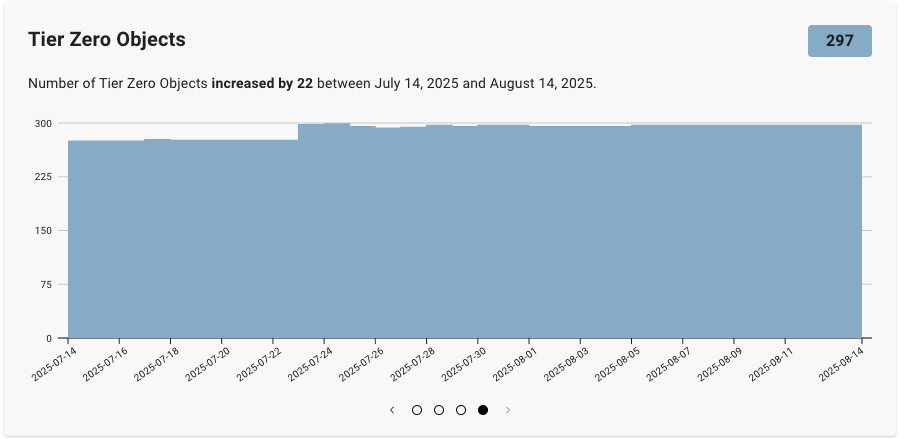
* **Objects** - This graph represents the trend in the total number of objects in the selected zone.
As you add or remove objects from the selected zone, this chart helps you track the changes in the number of objects over time.
 ## Completeness Graphs
For Active Directory environments, the **Group Completeness** and **Session Completeness** graphs represent how much visibility BloodHound Enterprise has into session and local group data across active computers in your environment.
BloodHound Enterprise calculates completeness as the percentage of all computers that it successfully scanned for sessions and groups. It includes only enabled computers with at least one login in the past 14 days.
## Completeness Graphs
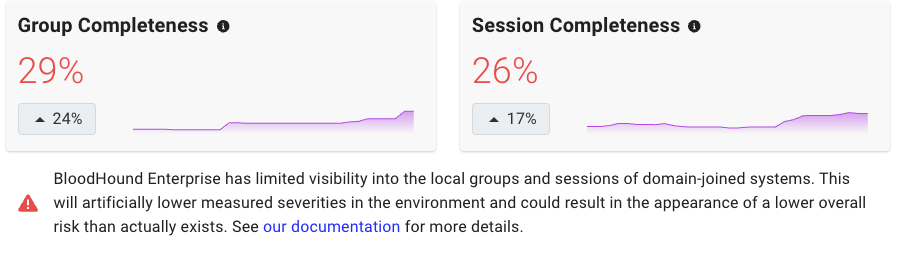
For Active Directory environments, the **Group Completeness** and **Session Completeness** graphs represent how much visibility BloodHound Enterprise has into session and local group data across active computers in your environment.
BloodHound Enterprise calculates completeness as the percentage of all computers that it successfully scanned for sessions and groups. It includes only enabled computers with at least one login in the past 14 days.
 The total collection completeness significantly impacts the accuracy of the graph available for analysis within BloodHound Enterprise. See [Why perform privileged collection in SharpHound](/collect-data/enterprise-collection/privileged-collection) for more details.