> ## Documentation Index
> Fetch the complete documentation index at: https://bloodhound.specterops.io/llms.txt
> Use this file to discover all available pages before exploring further.
# Graph View
> Review the exposure and impact of Attack Path findings in BloodHound Enterprise and access remediation guidance.
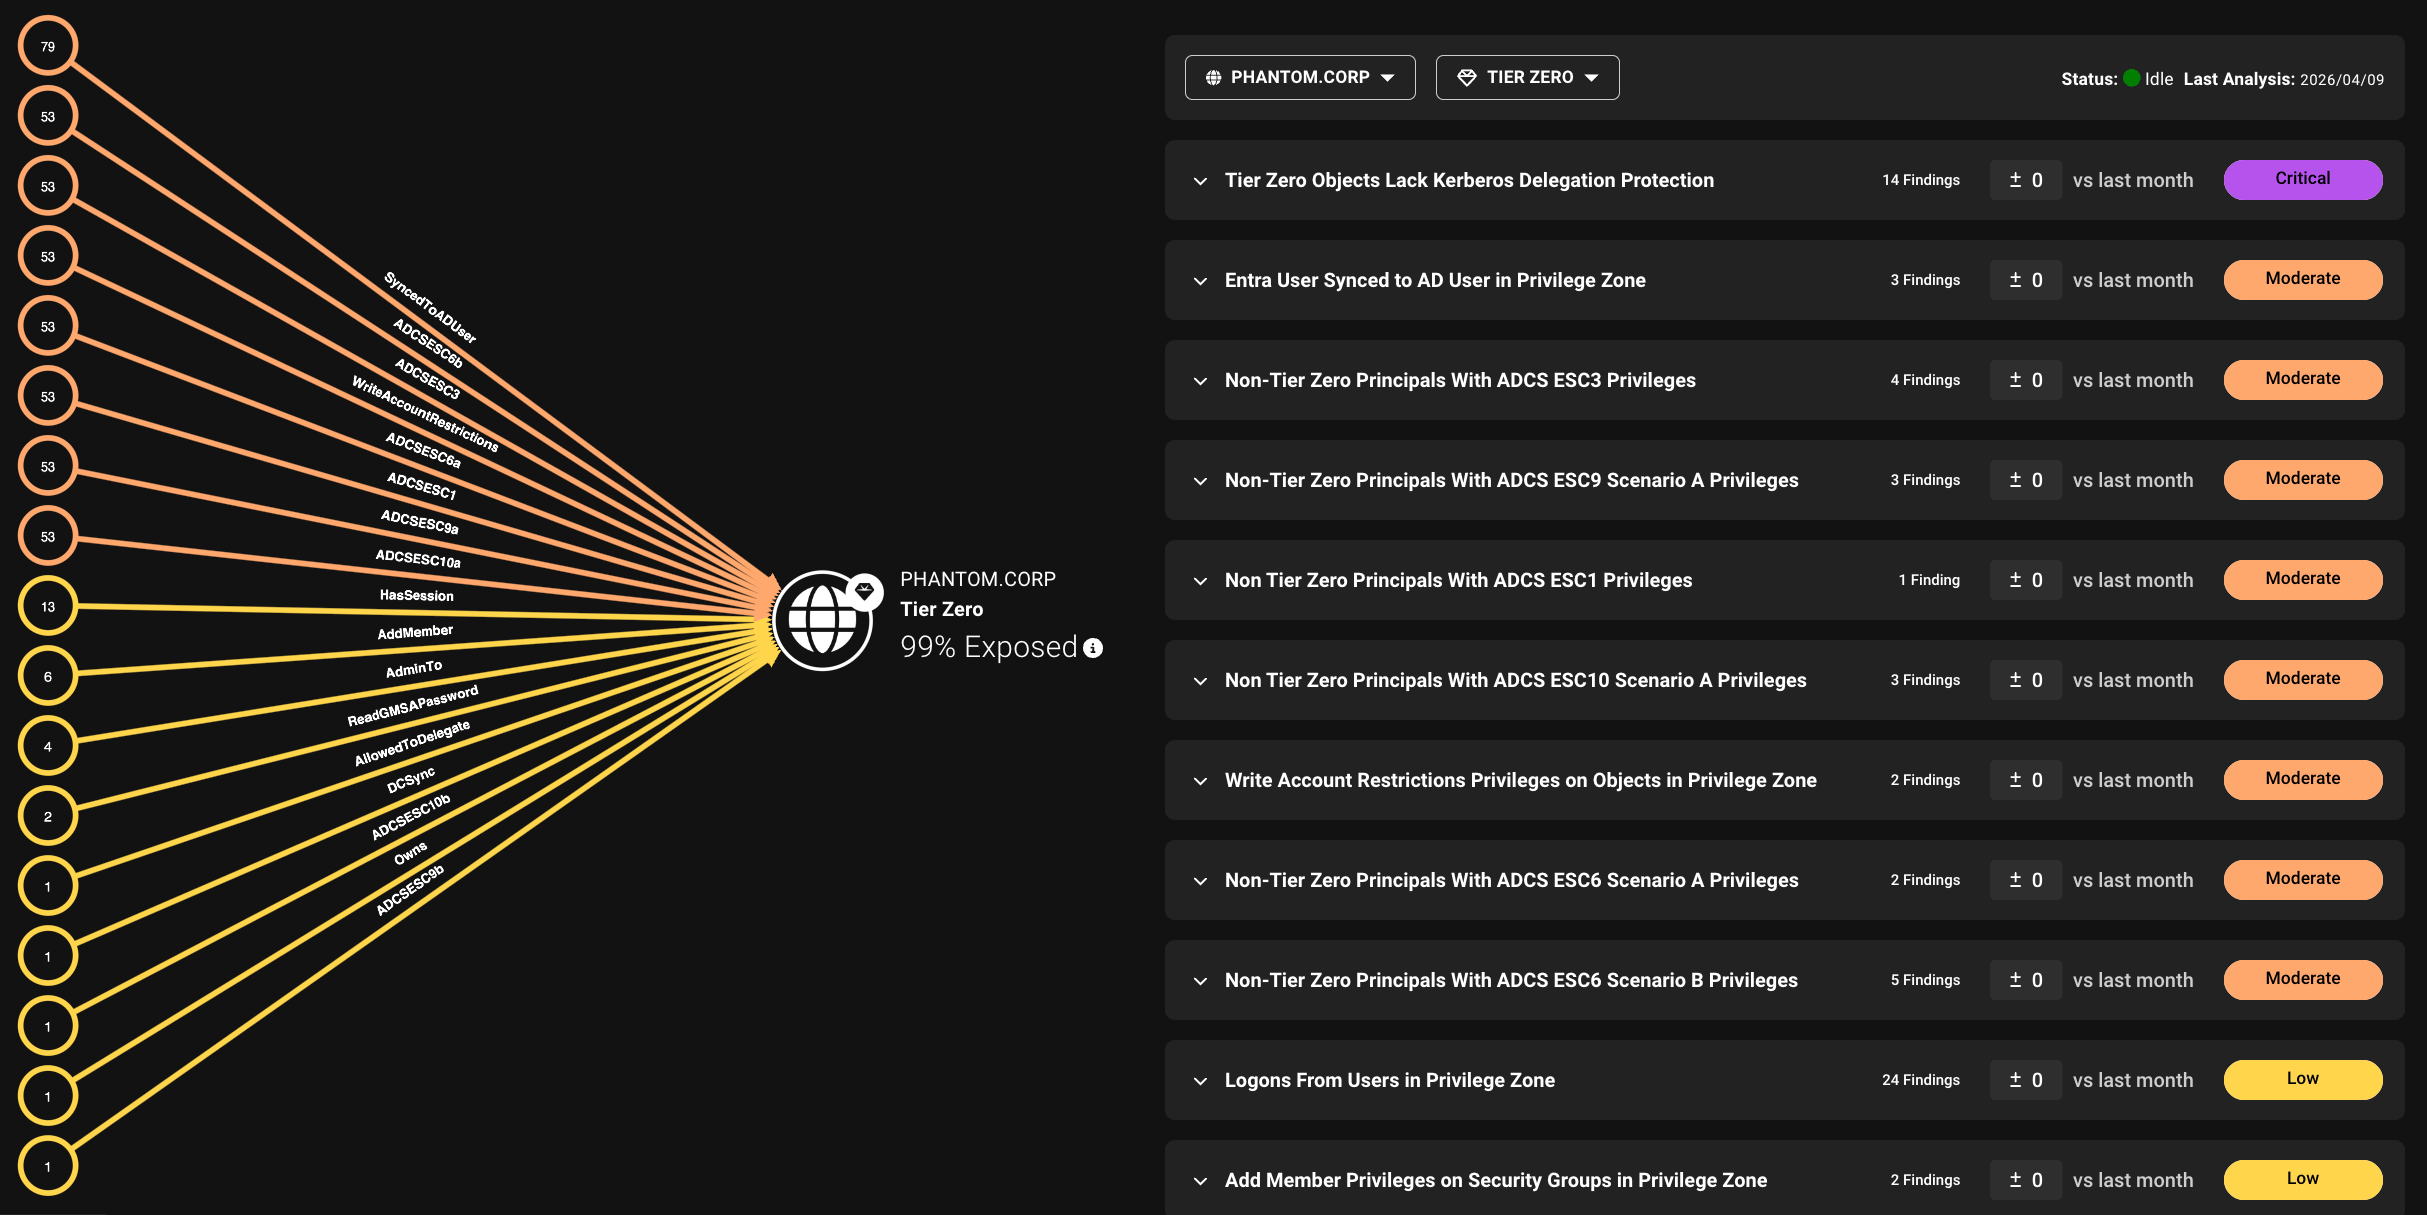
 The **Graph** view is the default view on the **Attack Paths** page. It combines the **Choke Point** graph with expandable finding details.
If [Environment Targeted Access Control (ETAC)](/manage-bloodhound/auth/environment-targeted-access-control) is enabled on your tenant, it can limit which findings and environments appear for your account.
The left-side of the page displays a **Choke Point** visualization, which is an aggregate view of the graph for a selected environment and privilege zone. It simplifies large volumes of nodes and edges into a compact visualization optimized for readability. It also shows the number of exposed principals in each finding category, giving you a quick summary of where risk concentrates in an environment.
The right-side of the page displays **Attack Paths details**, which is an expandable list of all detected Attack Path types. It shows finding descriptions, severity, principals involved, exposure and impact, and remediation guidance for each finding.
The **Graph** view is the default view on the **Attack Paths** page. It combines the **Choke Point** graph with expandable finding details.
If [Environment Targeted Access Control (ETAC)](/manage-bloodhound/auth/environment-targeted-access-control) is enabled on your tenant, it can limit which findings and environments appear for your account.
The left-side of the page displays a **Choke Point** visualization, which is an aggregate view of the graph for a selected environment and privilege zone. It simplifies large volumes of nodes and edges into a compact visualization optimized for readability. It also shows the number of exposed principals in each finding category, giving you a quick summary of where risk concentrates in an environment.
The right-side of the page displays **Attack Paths details**, which is an expandable list of all detected Attack Path types. It shows finding descriptions, severity, principals involved, exposure and impact, and remediation guidance for each finding.
 ## Use cases
Use the **Graph** view when you need to understand risk concentration and move from a high-level visualization to finding-level remediation details:
* **Identify where risk concentrates:** Review the **Choke Point** graph to see which finding categories expose the most principals in a selected environment and zone.
* **Prioritize remediation:** Use severity, exposure, and impact together to focus on findings that represent the greatest risk to privileged assets.
* **Investigate a finding type:** Expand **Attack Paths details** to review finding descriptions, the principals involved, exposure and impact metrics, and remediation guidance.
* **Review zone-specific risk:** Filter by environment and zone to understand how Attack Path findings differ across Tier Zero, user-defined privilege zones, and Hygiene.
* **Move from summary to action:** Use the graph to identify the area of concern, then use the finding details to plan remediation or accept a known risk.
## Filter findings
The **Attack Paths** page includes filters that help you focus on specific environments, platforms, zones, and severity levels. These filters apply to findings shown in the current view.
| Filter | Description |
| --------------- | ----------------------------------------------------------------------------------------------------------------------------------------------------------------------------------------------------------------------------------------------------------------------------------------------------------------------------------------------------------------------------------------------------------- |
| **Environment** | Filter findings by specific platforms, such as an Active Directory domain, Azure tenant, or OpenGraph environment. |
| **Zone** | Filter findings by specific privilege zones. By default, Tier Zero is selected, but you can choose to view findings for other zones. You can also use the zone filter to focus on findings by the Hygiene category. |
| **Risk** | Filter findings by severity level to focus on the highest-priority Attack Paths. |
The alternate [Table view](/analyze-data/findings/table-view) includes additional filters for the status of findings.
## Exposure and impact
Each finding includes exposure and impact metrics. Use these metrics together when prioritizing remediation efforts.
Findings with high exposure and high impact are typically the highest-priority remediation targets.
### Exposure
A risk measurement that quantifies the extent to which principals can reach a privileged asset through one or more Attack Paths. It encompasses all principals upstream of a finding's source, including any principals that can reach the source through intermediaries.
Exposure is measured in two ways:
* **Exposure count**—The number of principals that can reach a privileged asset through one or more Attack Paths.
* **Exposure percentage**—The percentage of principals in an environment that have at least one Attack Path to a privileged asset.
Exposure calculation only includes principals *outside* the selected zone (and higher zones) that can reach a privileged asset through an Attack Path.
### Impact
A risk measurement that quantifies potential blast radius if a finding is abused.
Impact is measured in two ways:
* **Impact count**—The number of principals that could be compromised through an Attack Path.
* **Impact percentage**—The percentage of the environment that could be impacted by a specific identity vulnerability.
Together, these metrics help organizations prioritize remediation by understanding which Attack Paths pose the greatest risk.
## Use cases
Use the **Graph** view when you need to understand risk concentration and move from a high-level visualization to finding-level remediation details:
* **Identify where risk concentrates:** Review the **Choke Point** graph to see which finding categories expose the most principals in a selected environment and zone.
* **Prioritize remediation:** Use severity, exposure, and impact together to focus on findings that represent the greatest risk to privileged assets.
* **Investigate a finding type:** Expand **Attack Paths details** to review finding descriptions, the principals involved, exposure and impact metrics, and remediation guidance.
* **Review zone-specific risk:** Filter by environment and zone to understand how Attack Path findings differ across Tier Zero, user-defined privilege zones, and Hygiene.
* **Move from summary to action:** Use the graph to identify the area of concern, then use the finding details to plan remediation or accept a known risk.
## Filter findings
The **Attack Paths** page includes filters that help you focus on specific environments, platforms, zones, and severity levels. These filters apply to findings shown in the current view.
| Filter | Description |
| --------------- | ----------------------------------------------------------------------------------------------------------------------------------------------------------------------------------------------------------------------------------------------------------------------------------------------------------------------------------------------------------------------------------------------------------- |
| **Environment** | Filter findings by specific platforms, such as an Active Directory domain, Azure tenant, or OpenGraph environment. |
| **Zone** | Filter findings by specific privilege zones. By default, Tier Zero is selected, but you can choose to view findings for other zones. You can also use the zone filter to focus on findings by the Hygiene category. |
| **Risk** | Filter findings by severity level to focus on the highest-priority Attack Paths. |
The alternate [Table view](/analyze-data/findings/table-view) includes additional filters for the status of findings.
## Exposure and impact
Each finding includes exposure and impact metrics. Use these metrics together when prioritizing remediation efforts.
Findings with high exposure and high impact are typically the highest-priority remediation targets.
### Exposure
A risk measurement that quantifies the extent to which principals can reach a privileged asset through one or more Attack Paths. It encompasses all principals upstream of a finding's source, including any principals that can reach the source through intermediaries.
Exposure is measured in two ways:
* **Exposure count**—The number of principals that can reach a privileged asset through one or more Attack Paths.
* **Exposure percentage**—The percentage of principals in an environment that have at least one Attack Path to a privileged asset.
Exposure calculation only includes principals *outside* the selected zone (and higher zones) that can reach a privileged asset through an Attack Path.
### Impact
A risk measurement that quantifies potential blast radius if a finding is abused.
Impact is measured in two ways:
* **Impact count**—The number of principals that could be compromised through an Attack Path.
* **Impact percentage**—The percentage of the environment that could be impacted by a specific identity vulnerability.
Together, these metrics help organizations prioritize remediation by understanding which Attack Paths pose the greatest risk.